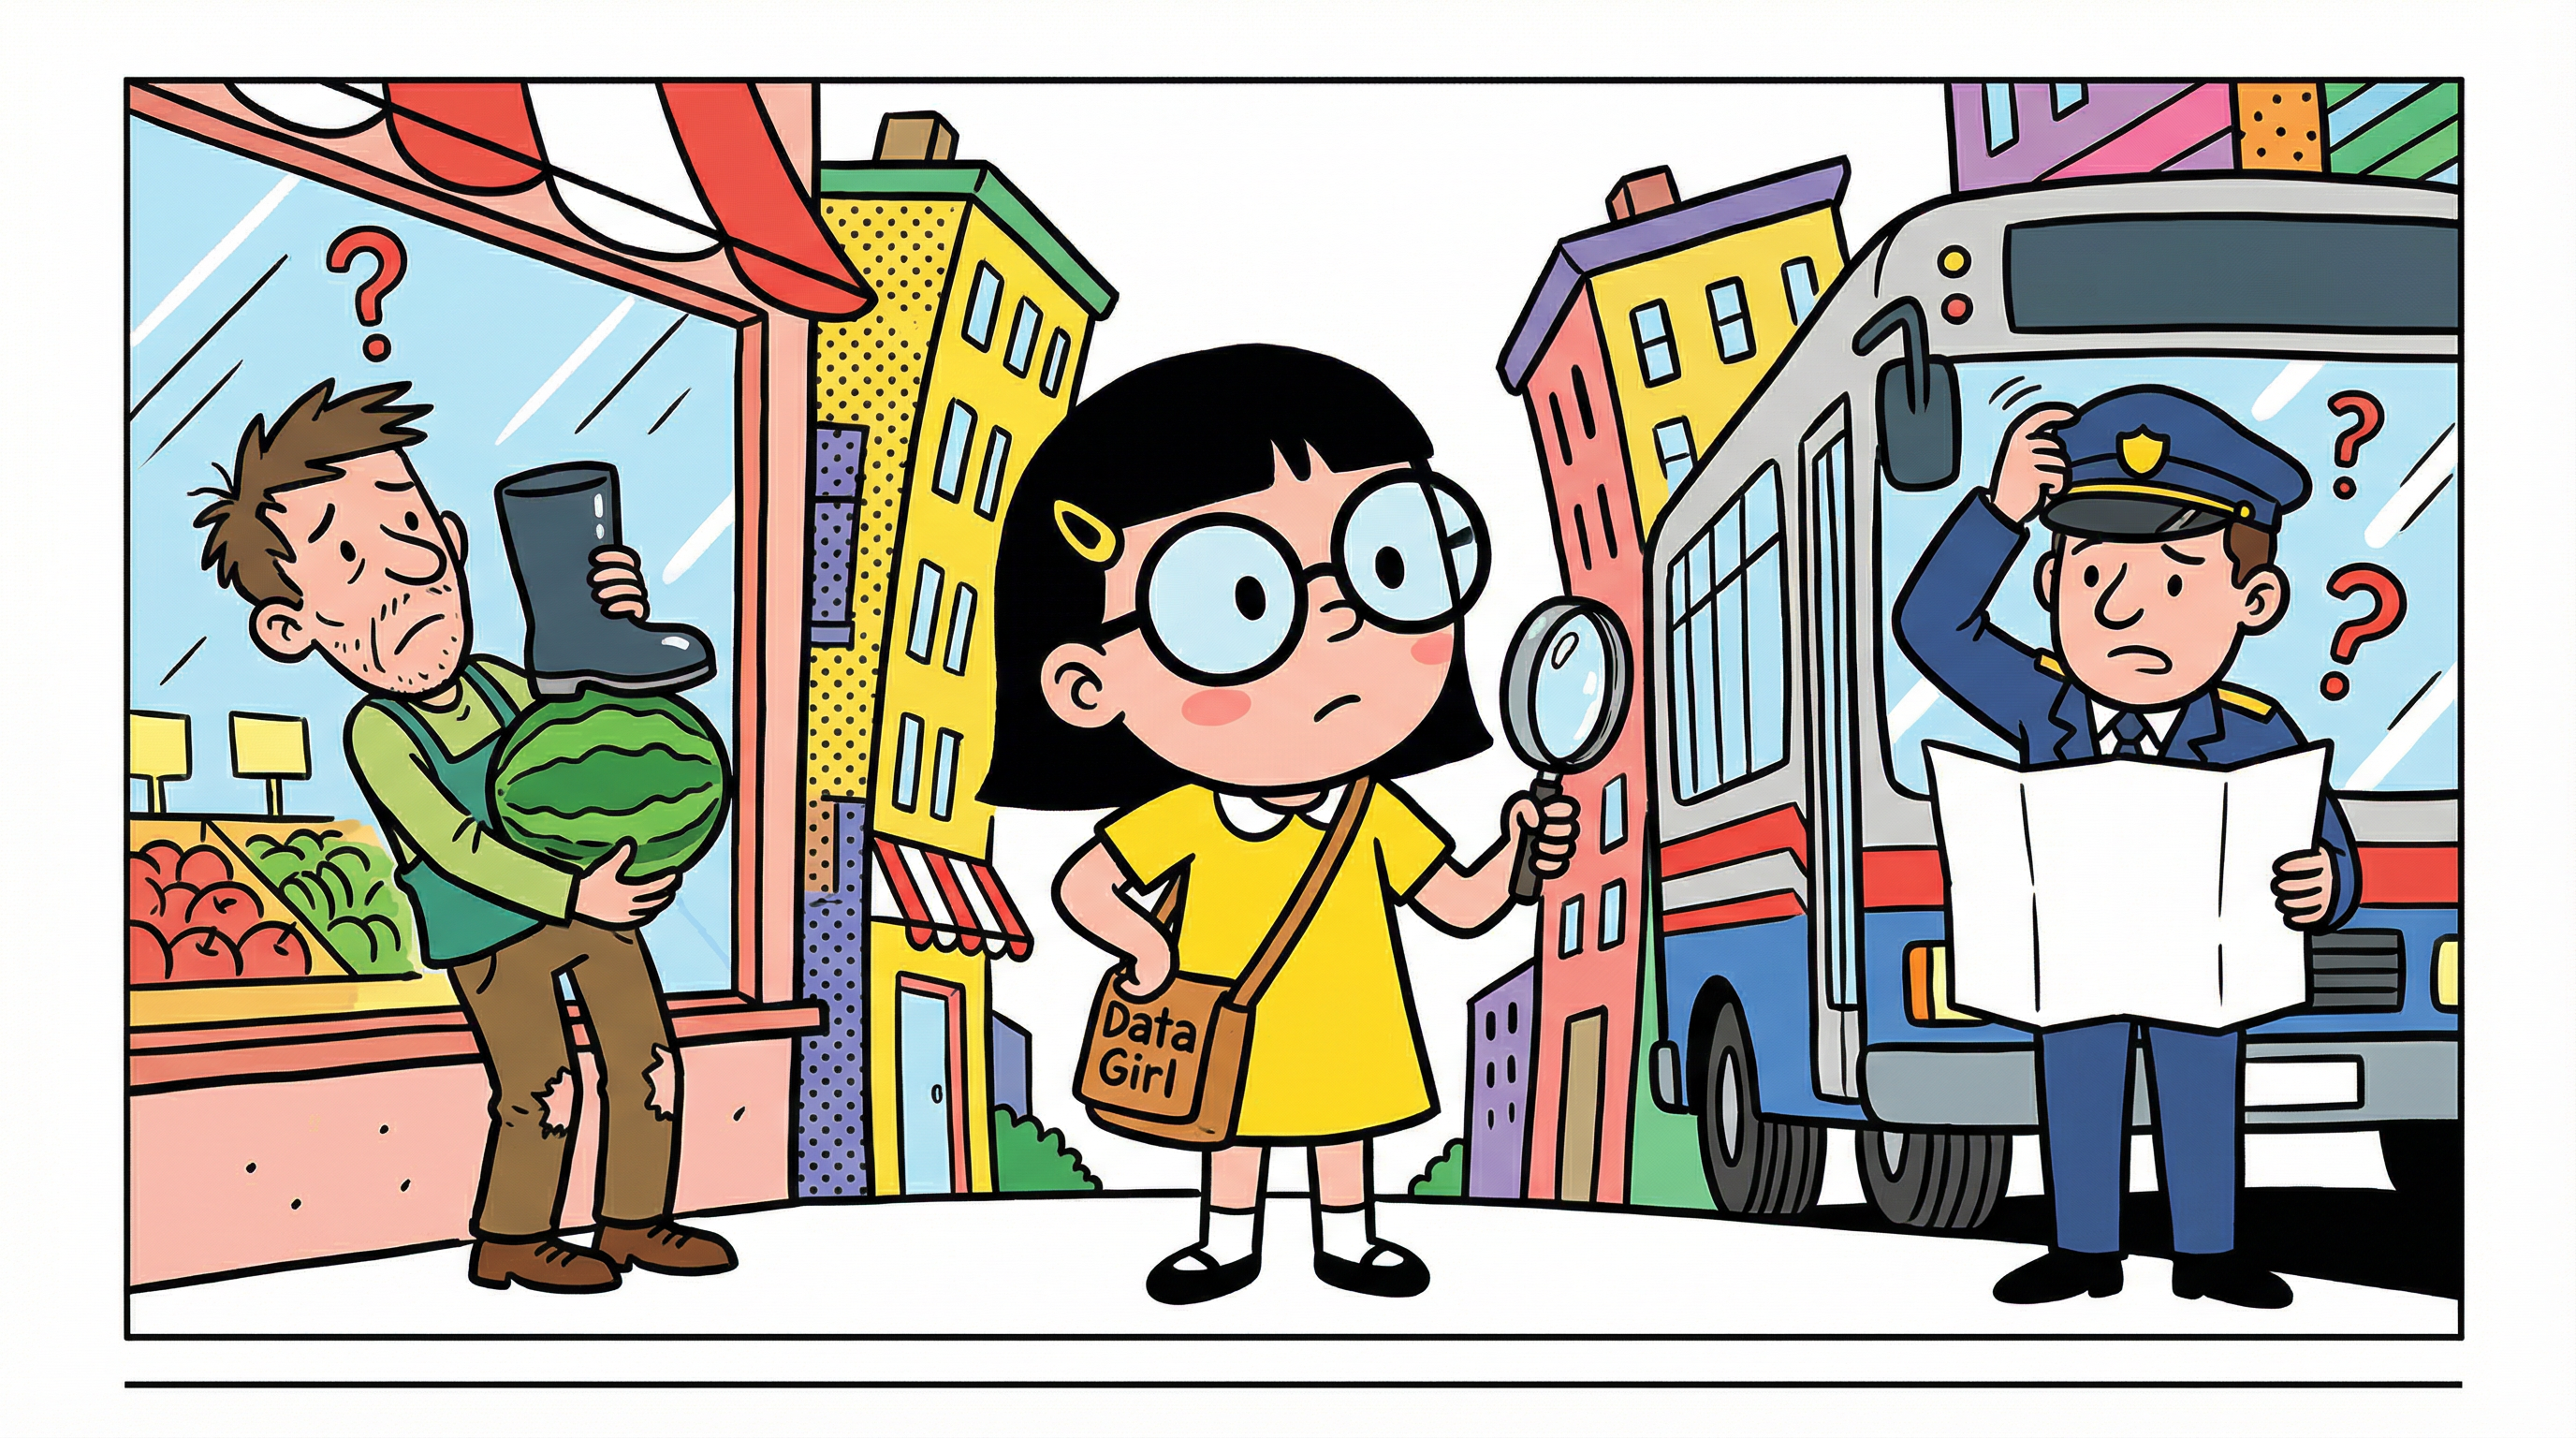
Scene 1: A World Without Data
In a bustling city full of questions, everyone is making decisions based on guesswork. Shop owners stock the wrong items, bus drivers take random routes, and managers rely on gut feelings. The city is chaotic — and nobody knows why things keep going wrong.
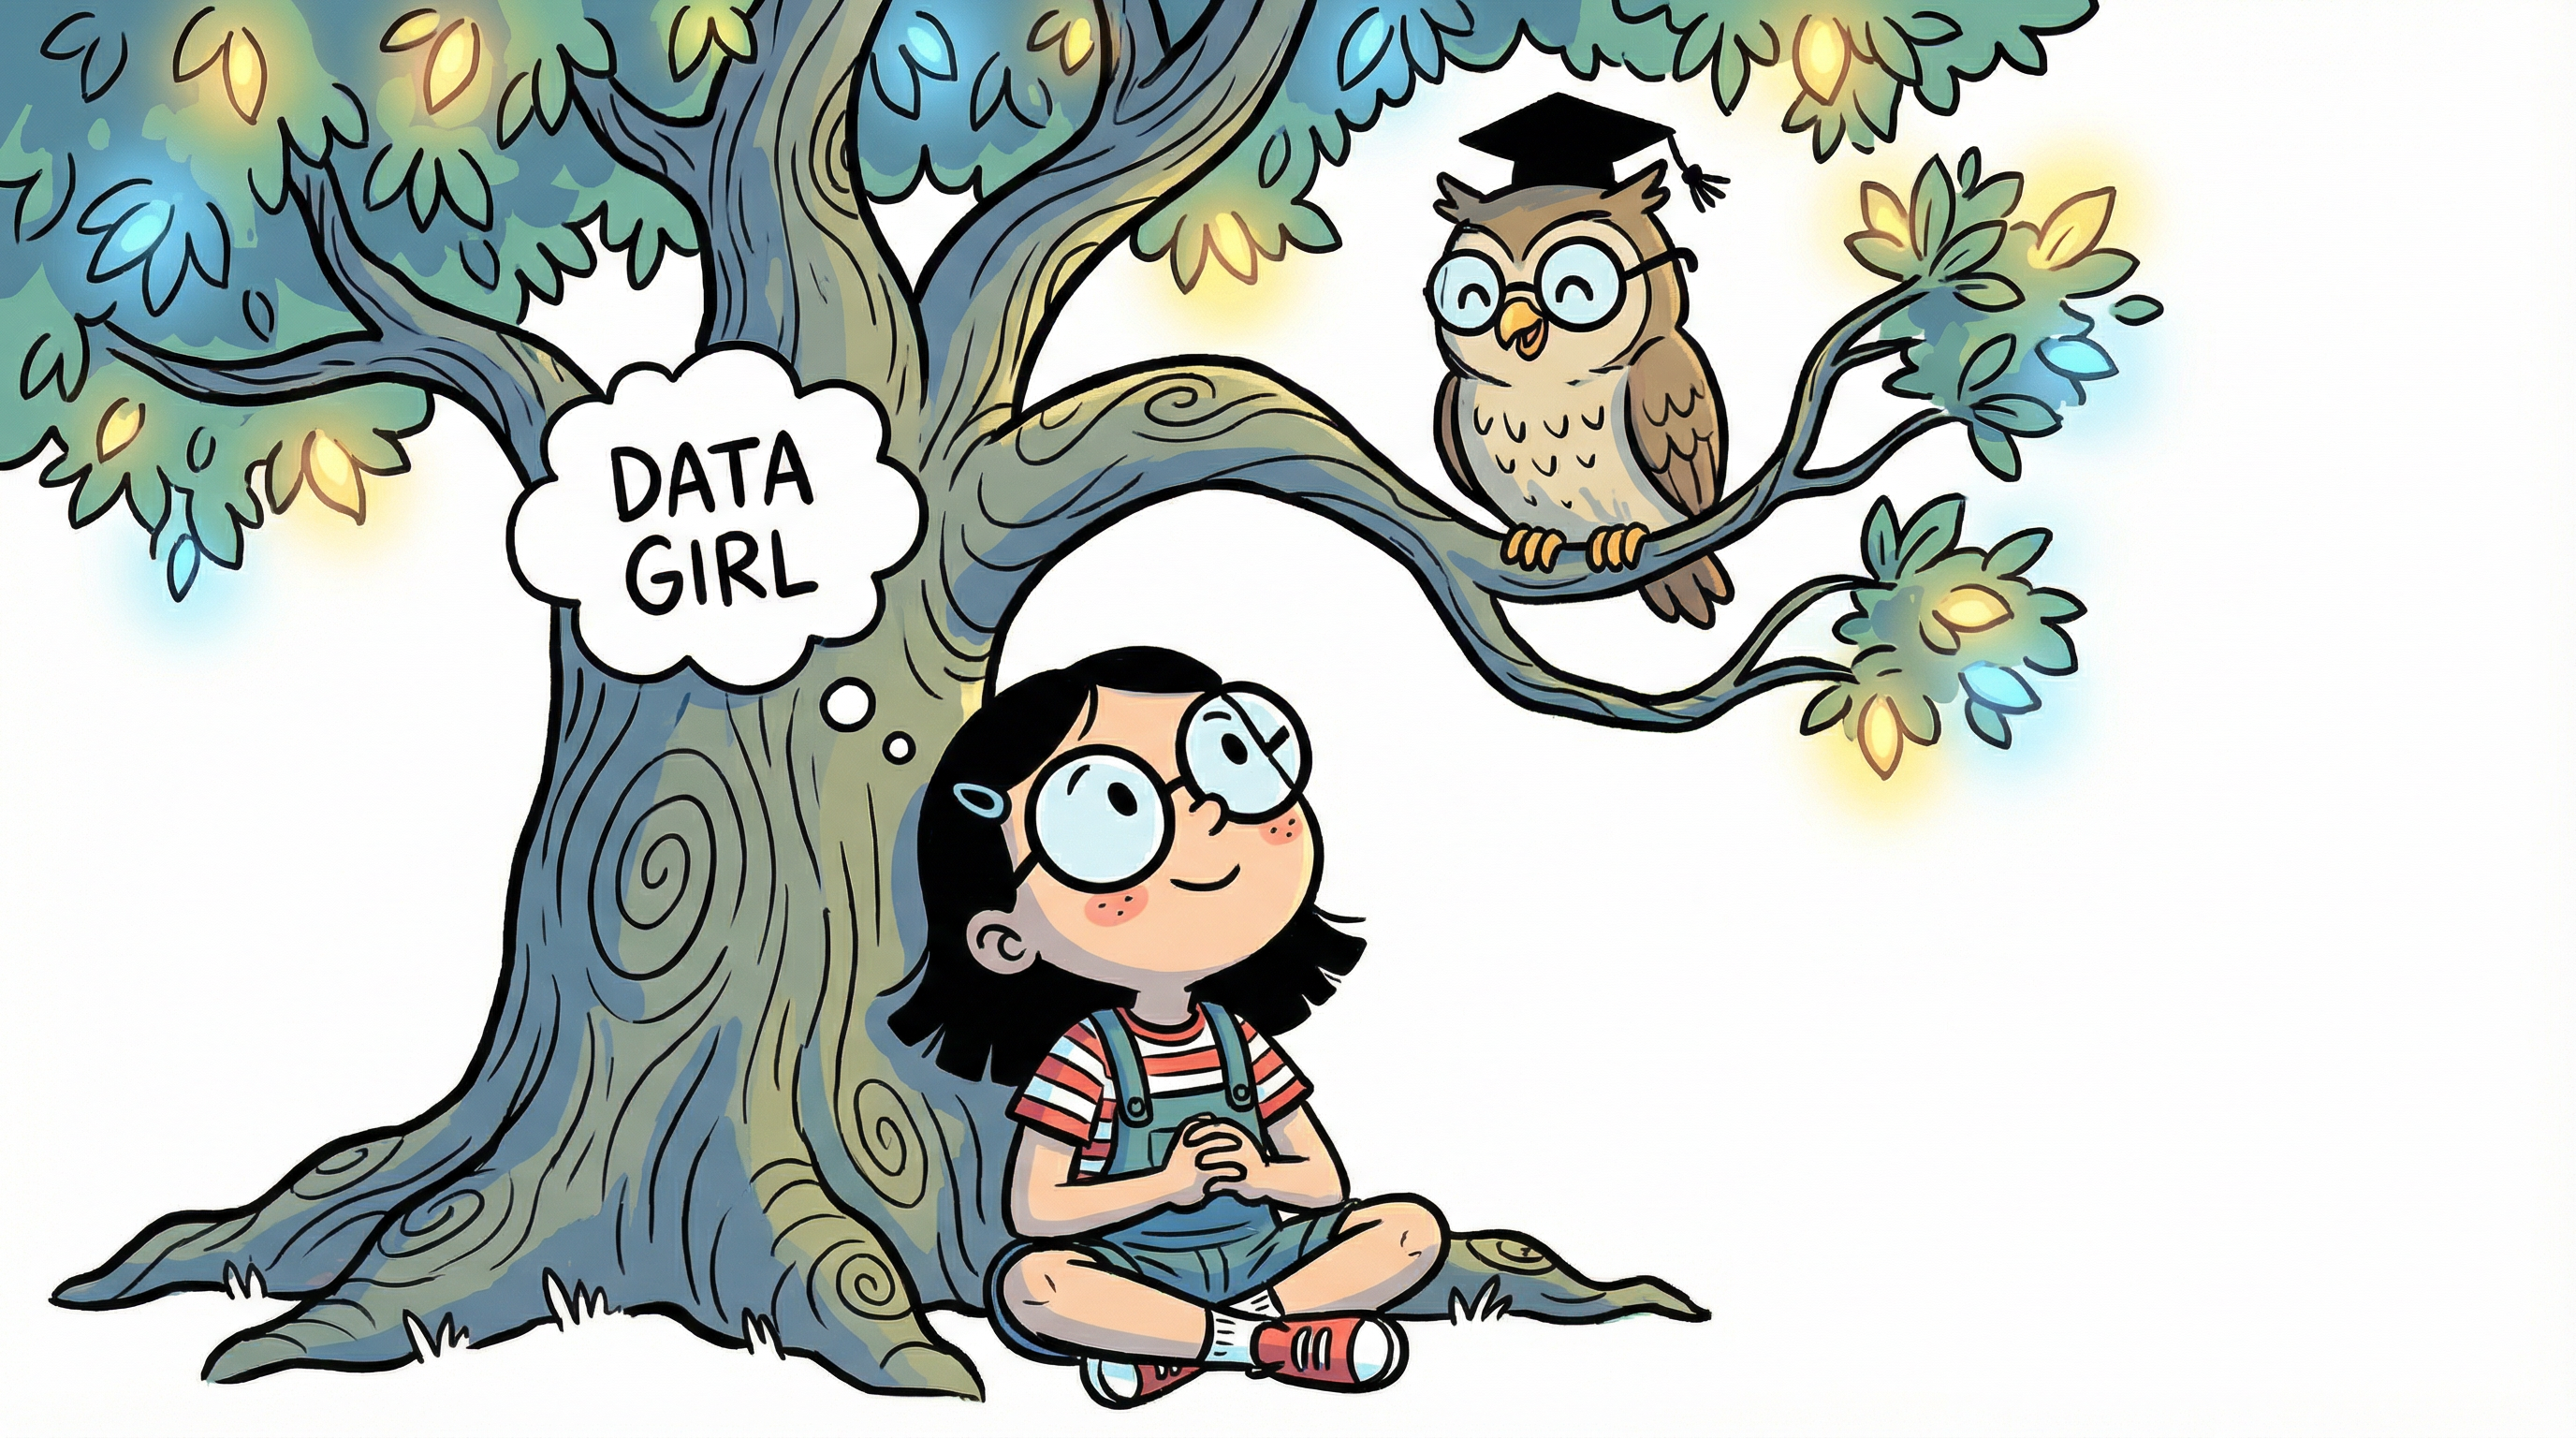
Scene 2: Enter the Wise Owl
Lost in the confusion, young Data Girl sits under a magical tree. A wise owl wearing a graduation cap perches above her, ready to share the secret of turning chaos into clarity.
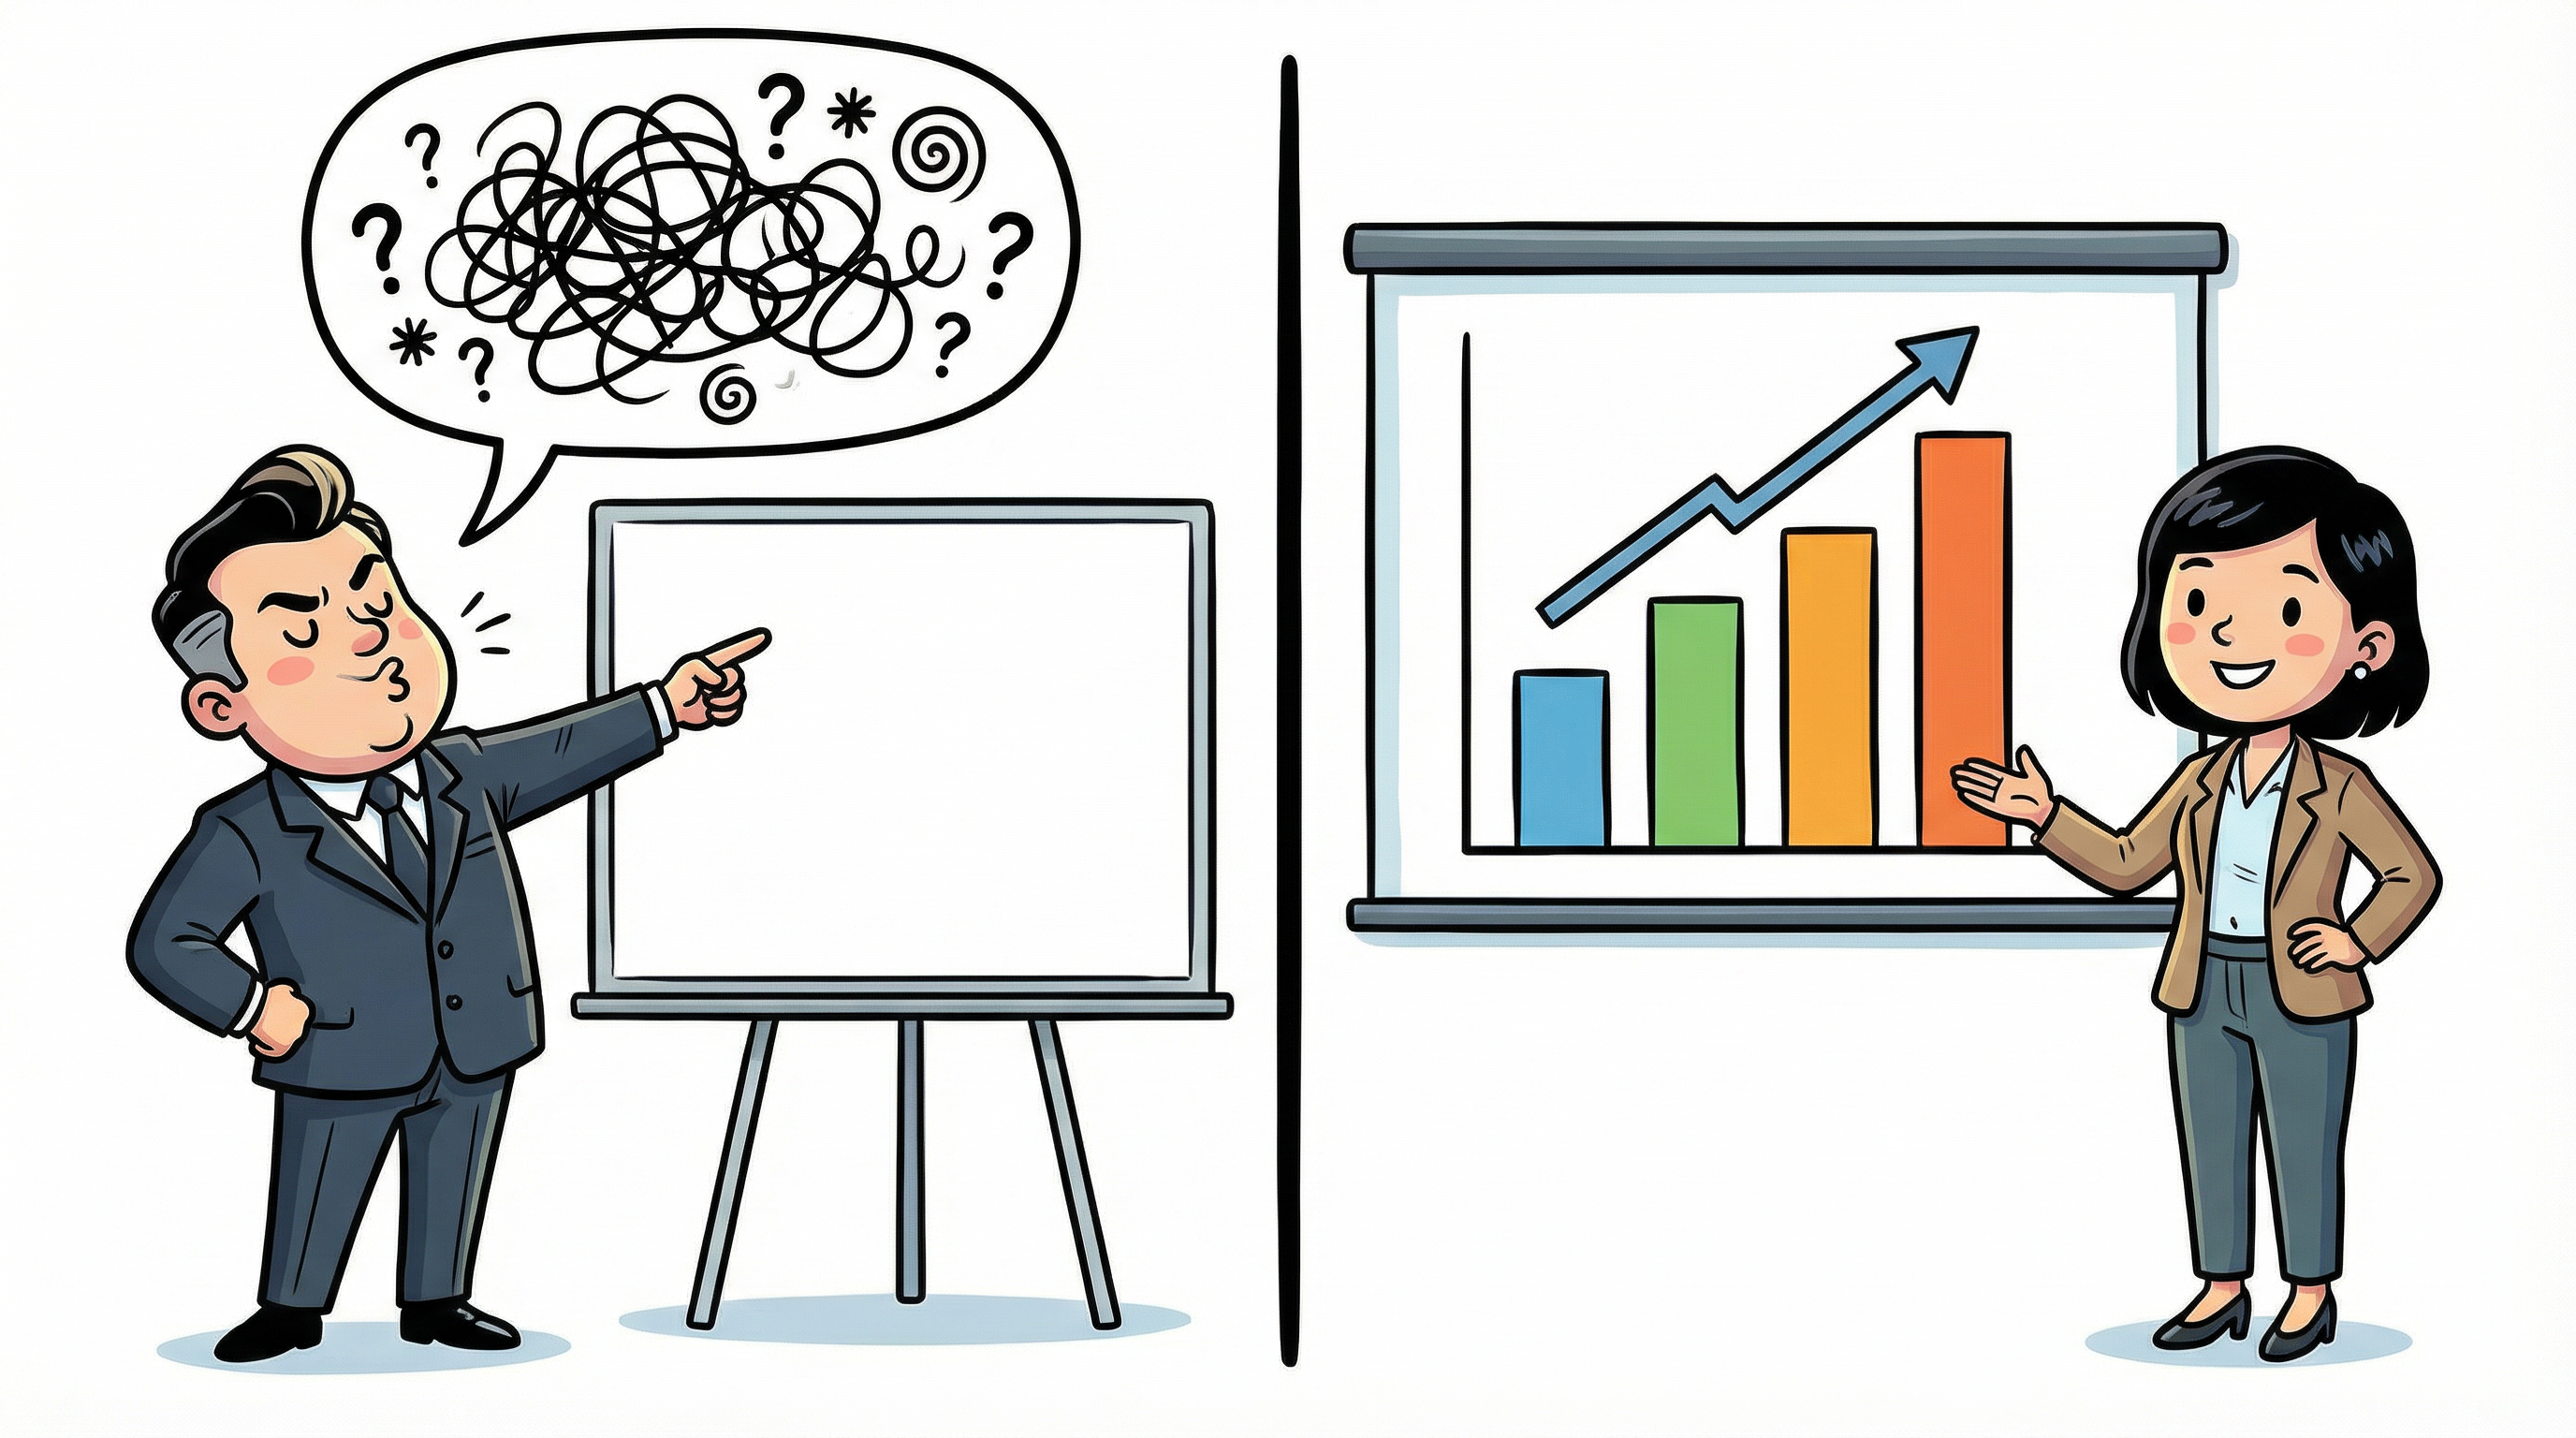
Scene 3: Opinion vs. Data
The owl reveals the first great truth: there is a fundamental difference between an opinion and a data-driven insight. One is noise; the other is signal.
"Without data, you're just another person with an opinion." — W. Edwards Deming
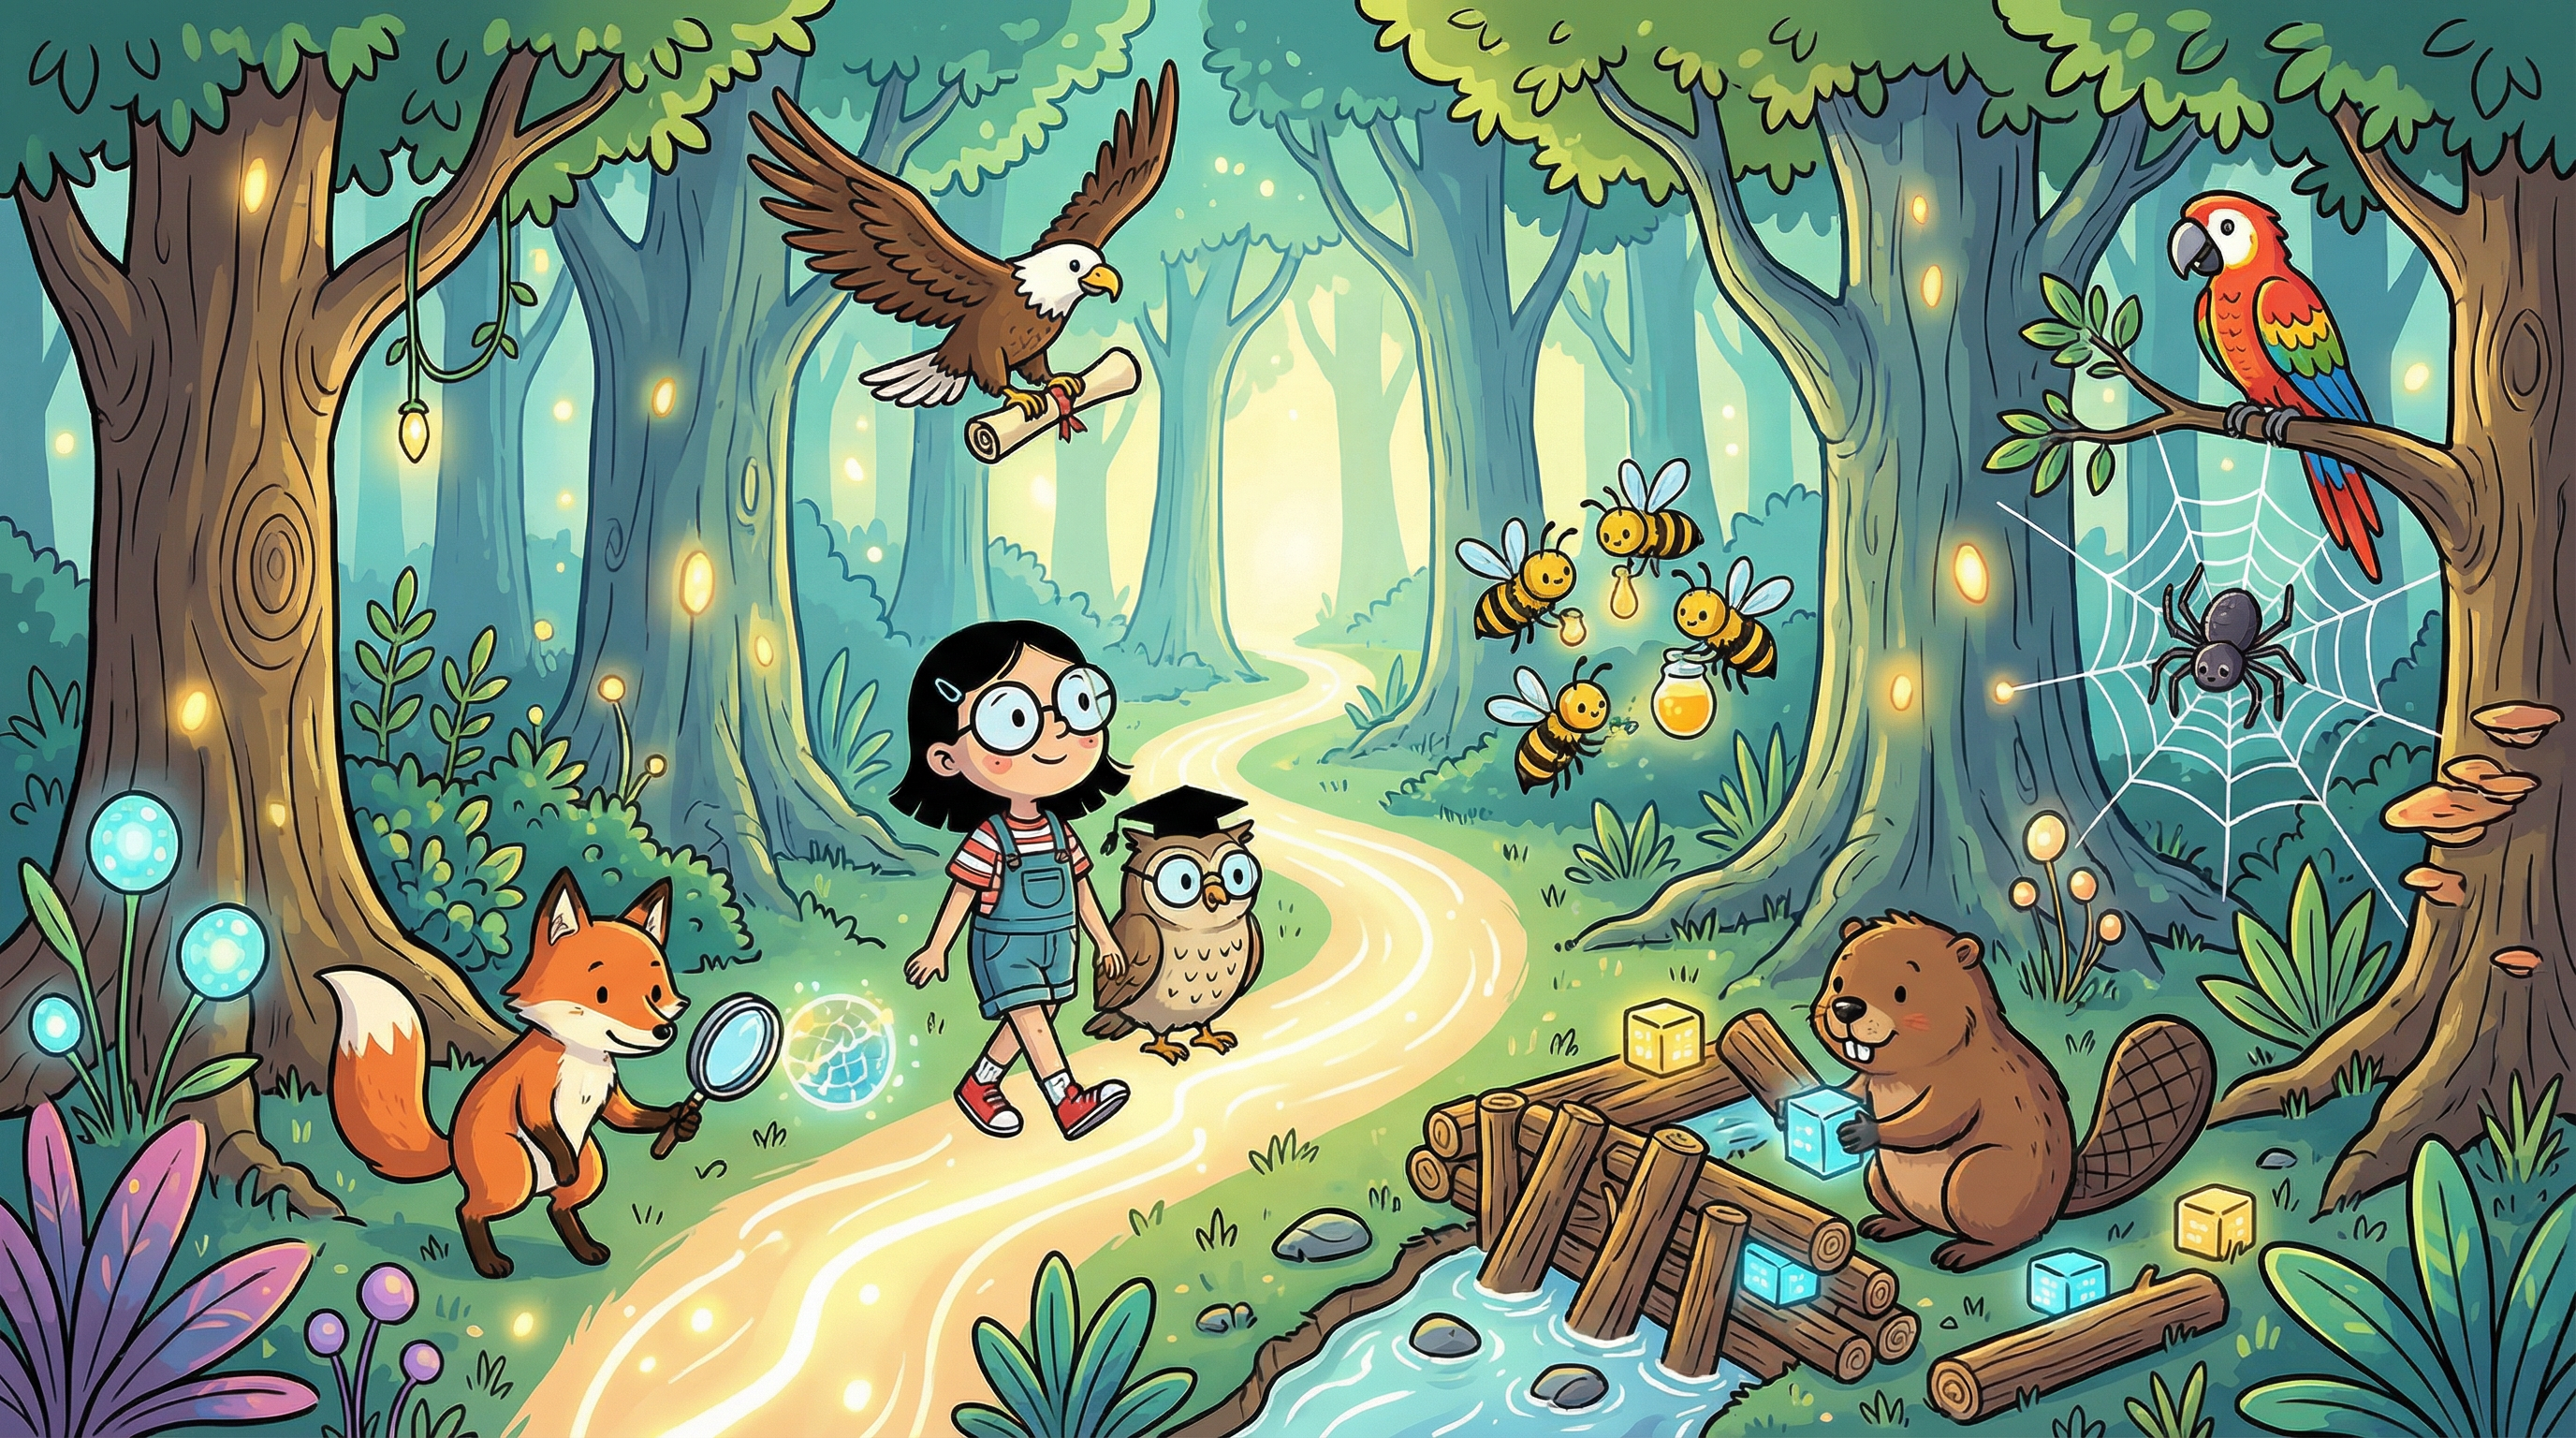
Scene 4: Welcome to the Data Forest
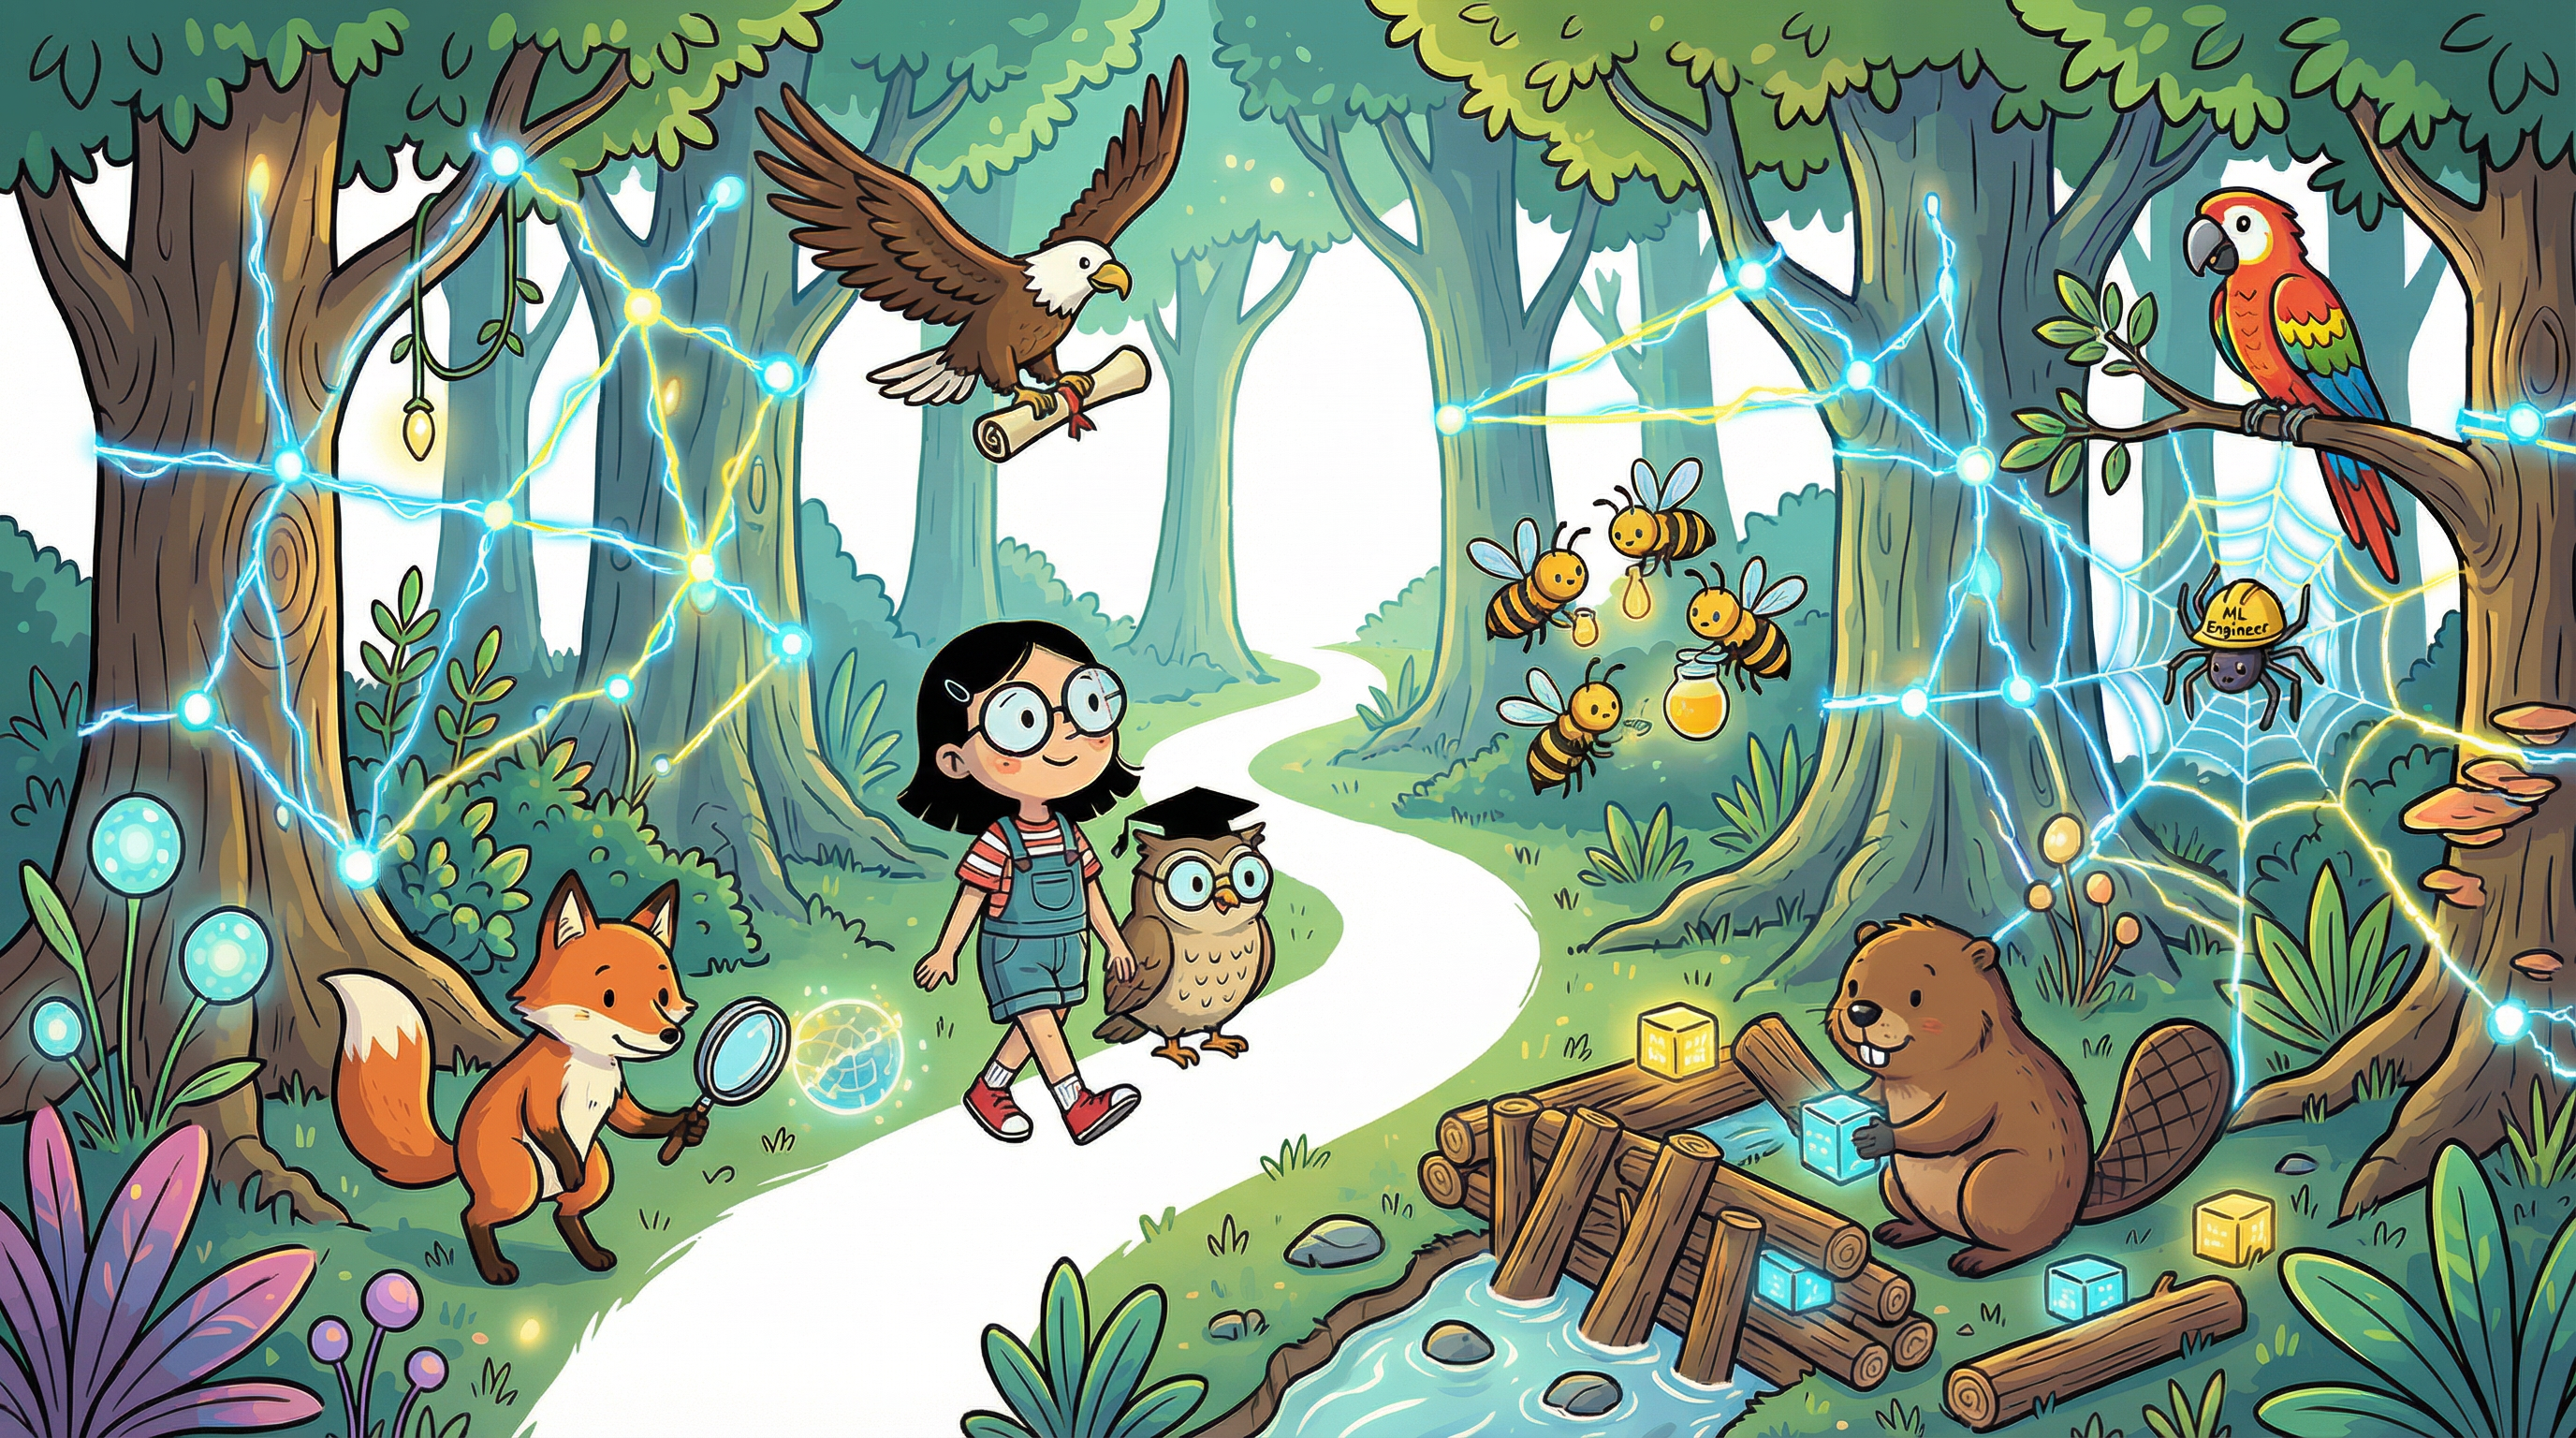
The owl leads Data Girl into the magical Data Forest — a thriving ecosystem where every creature plays a vital role in transforming raw data into powerful decisions. Here, teamwork is everything.
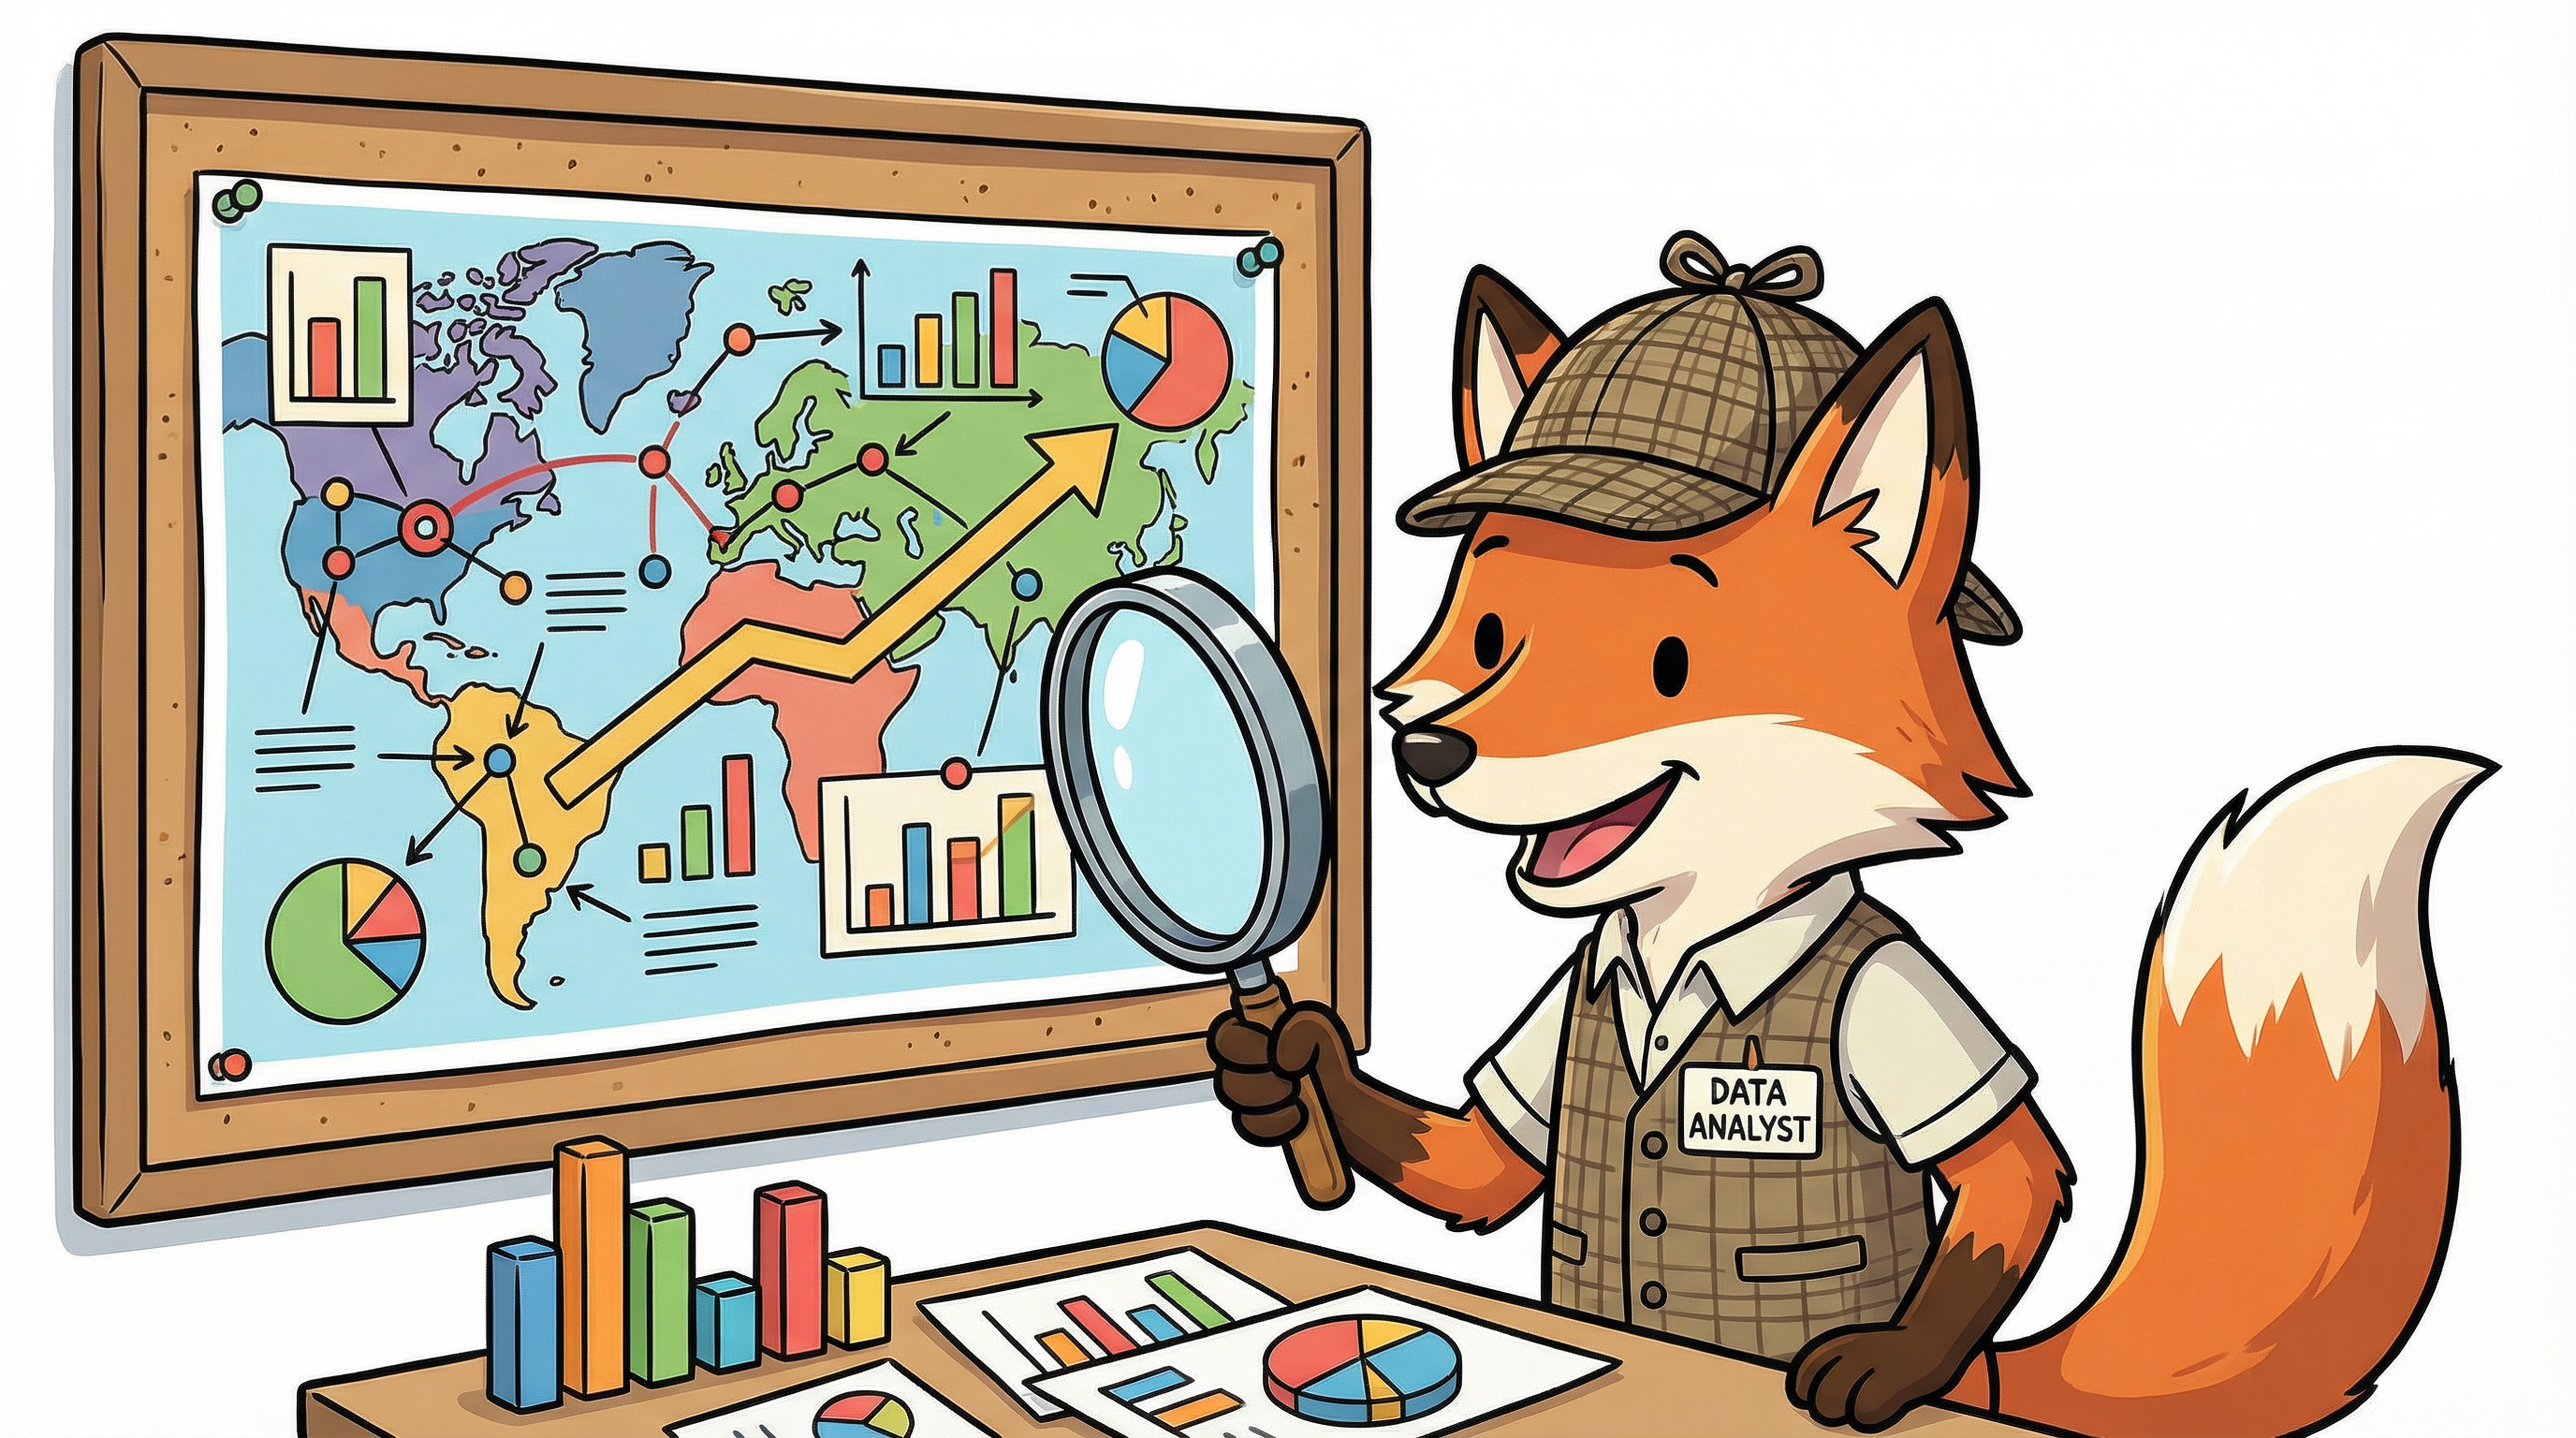
Scene 5: The Data Analyst — The Pathfinder
Data AnalystThe clever fox is the Data Analyst. Armed with a magnifying glass and a sharp eye for patterns, the fox answers the critical business questions: What happened? Why did it happen? The Data Analyst is the bridge between raw data and management decisions.
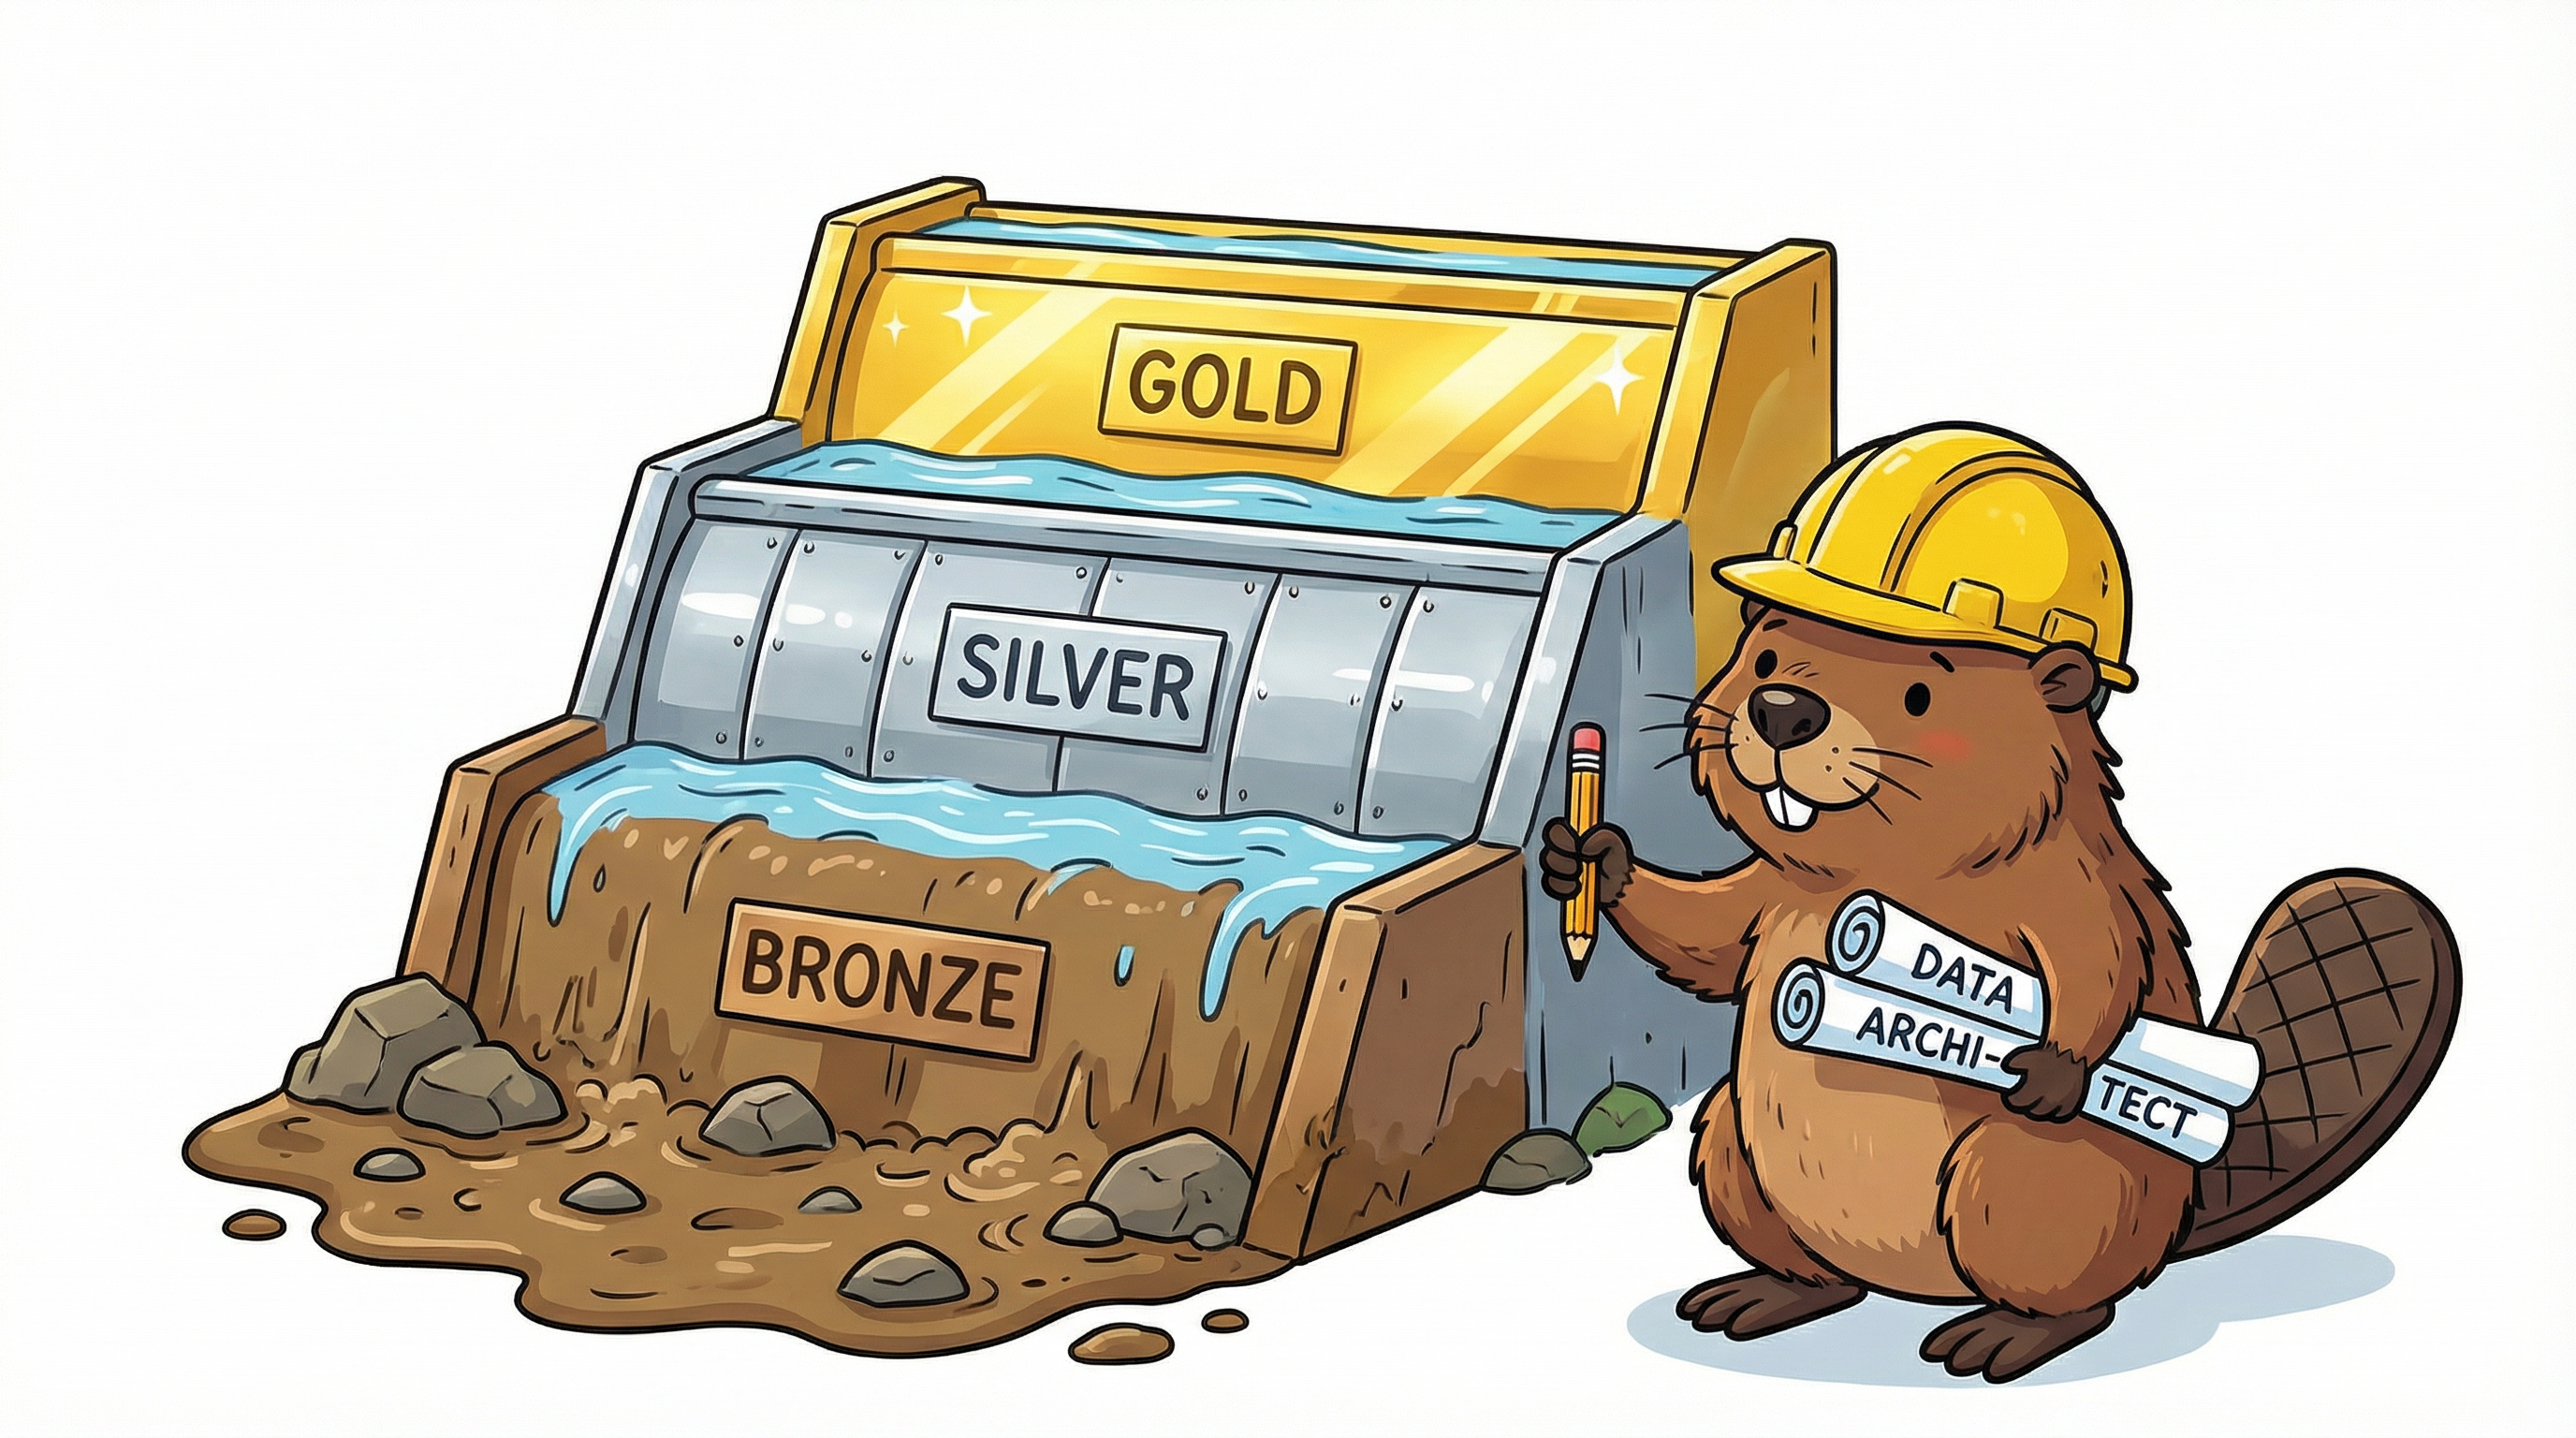
Scene 6: The Data Architect — The Master Planner
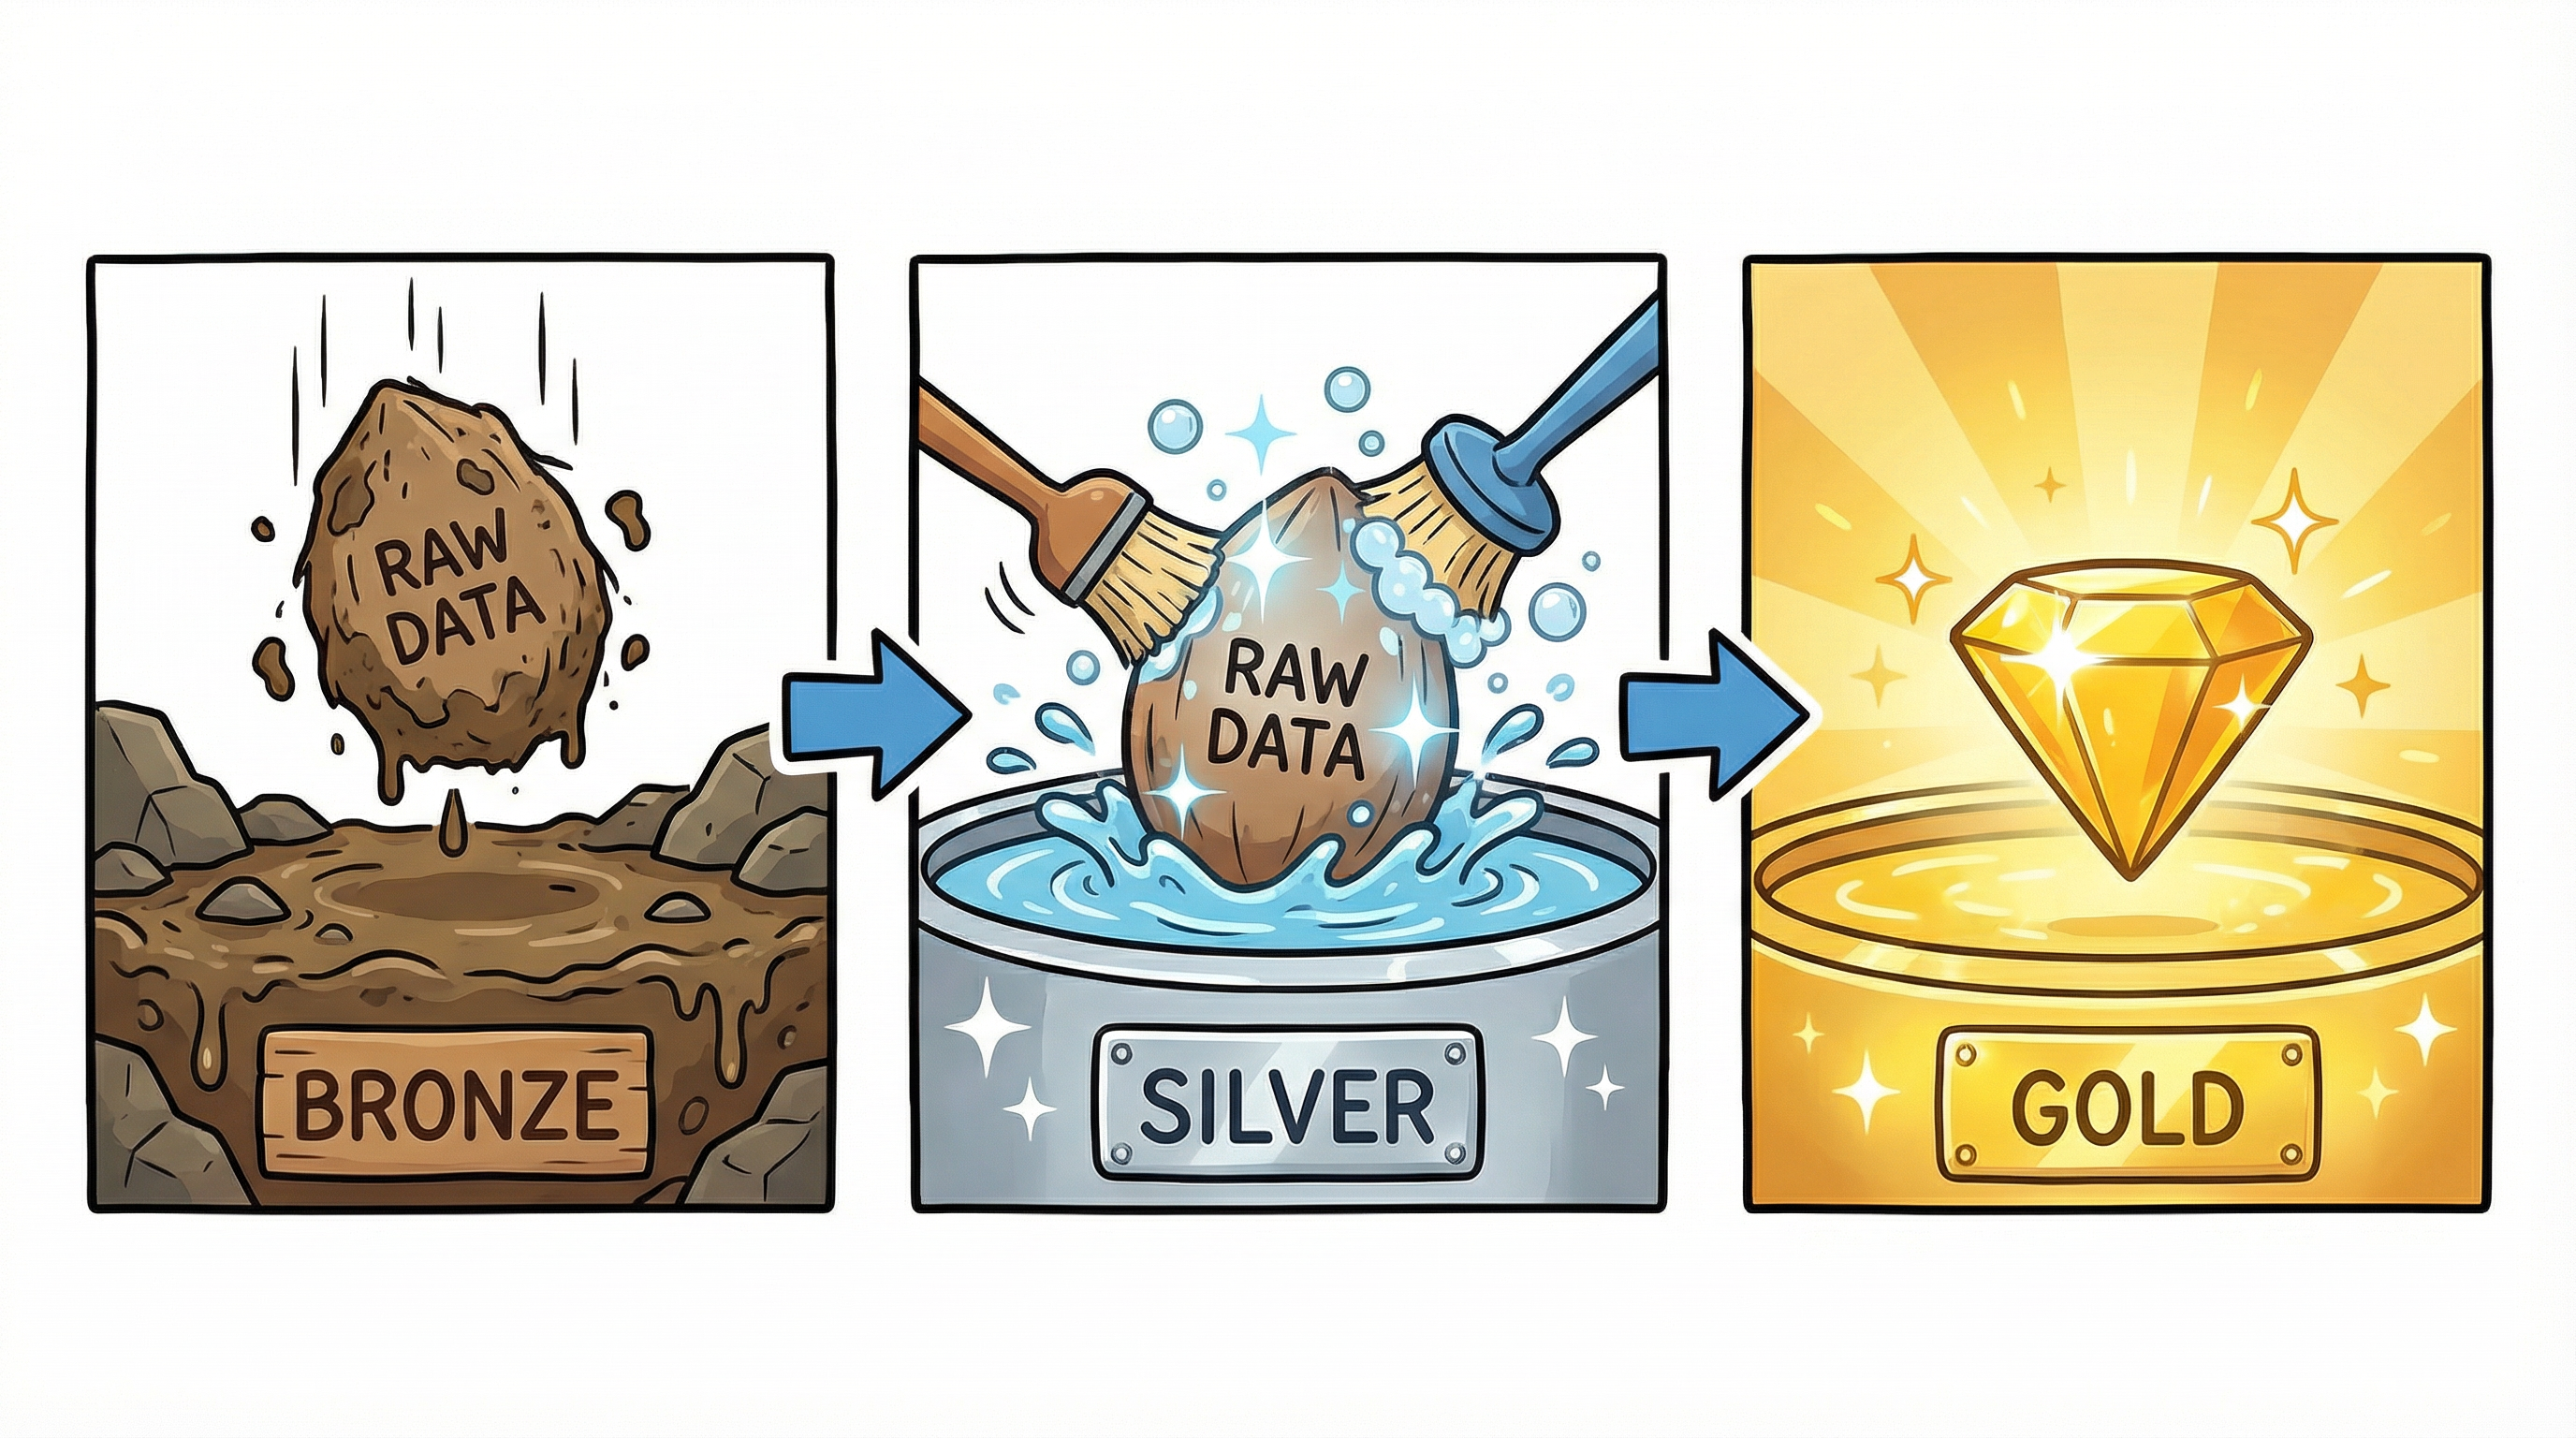
Data ArchitectThe meticulous beaver is the Data Architect. Before any data can be used, it must be stored properly. The architect designs a three-tiered data warehouse: Bronze (raw, unprocessed data), Silver (cleaned and transformed data), and Gold (business-ready, aggregated insights).
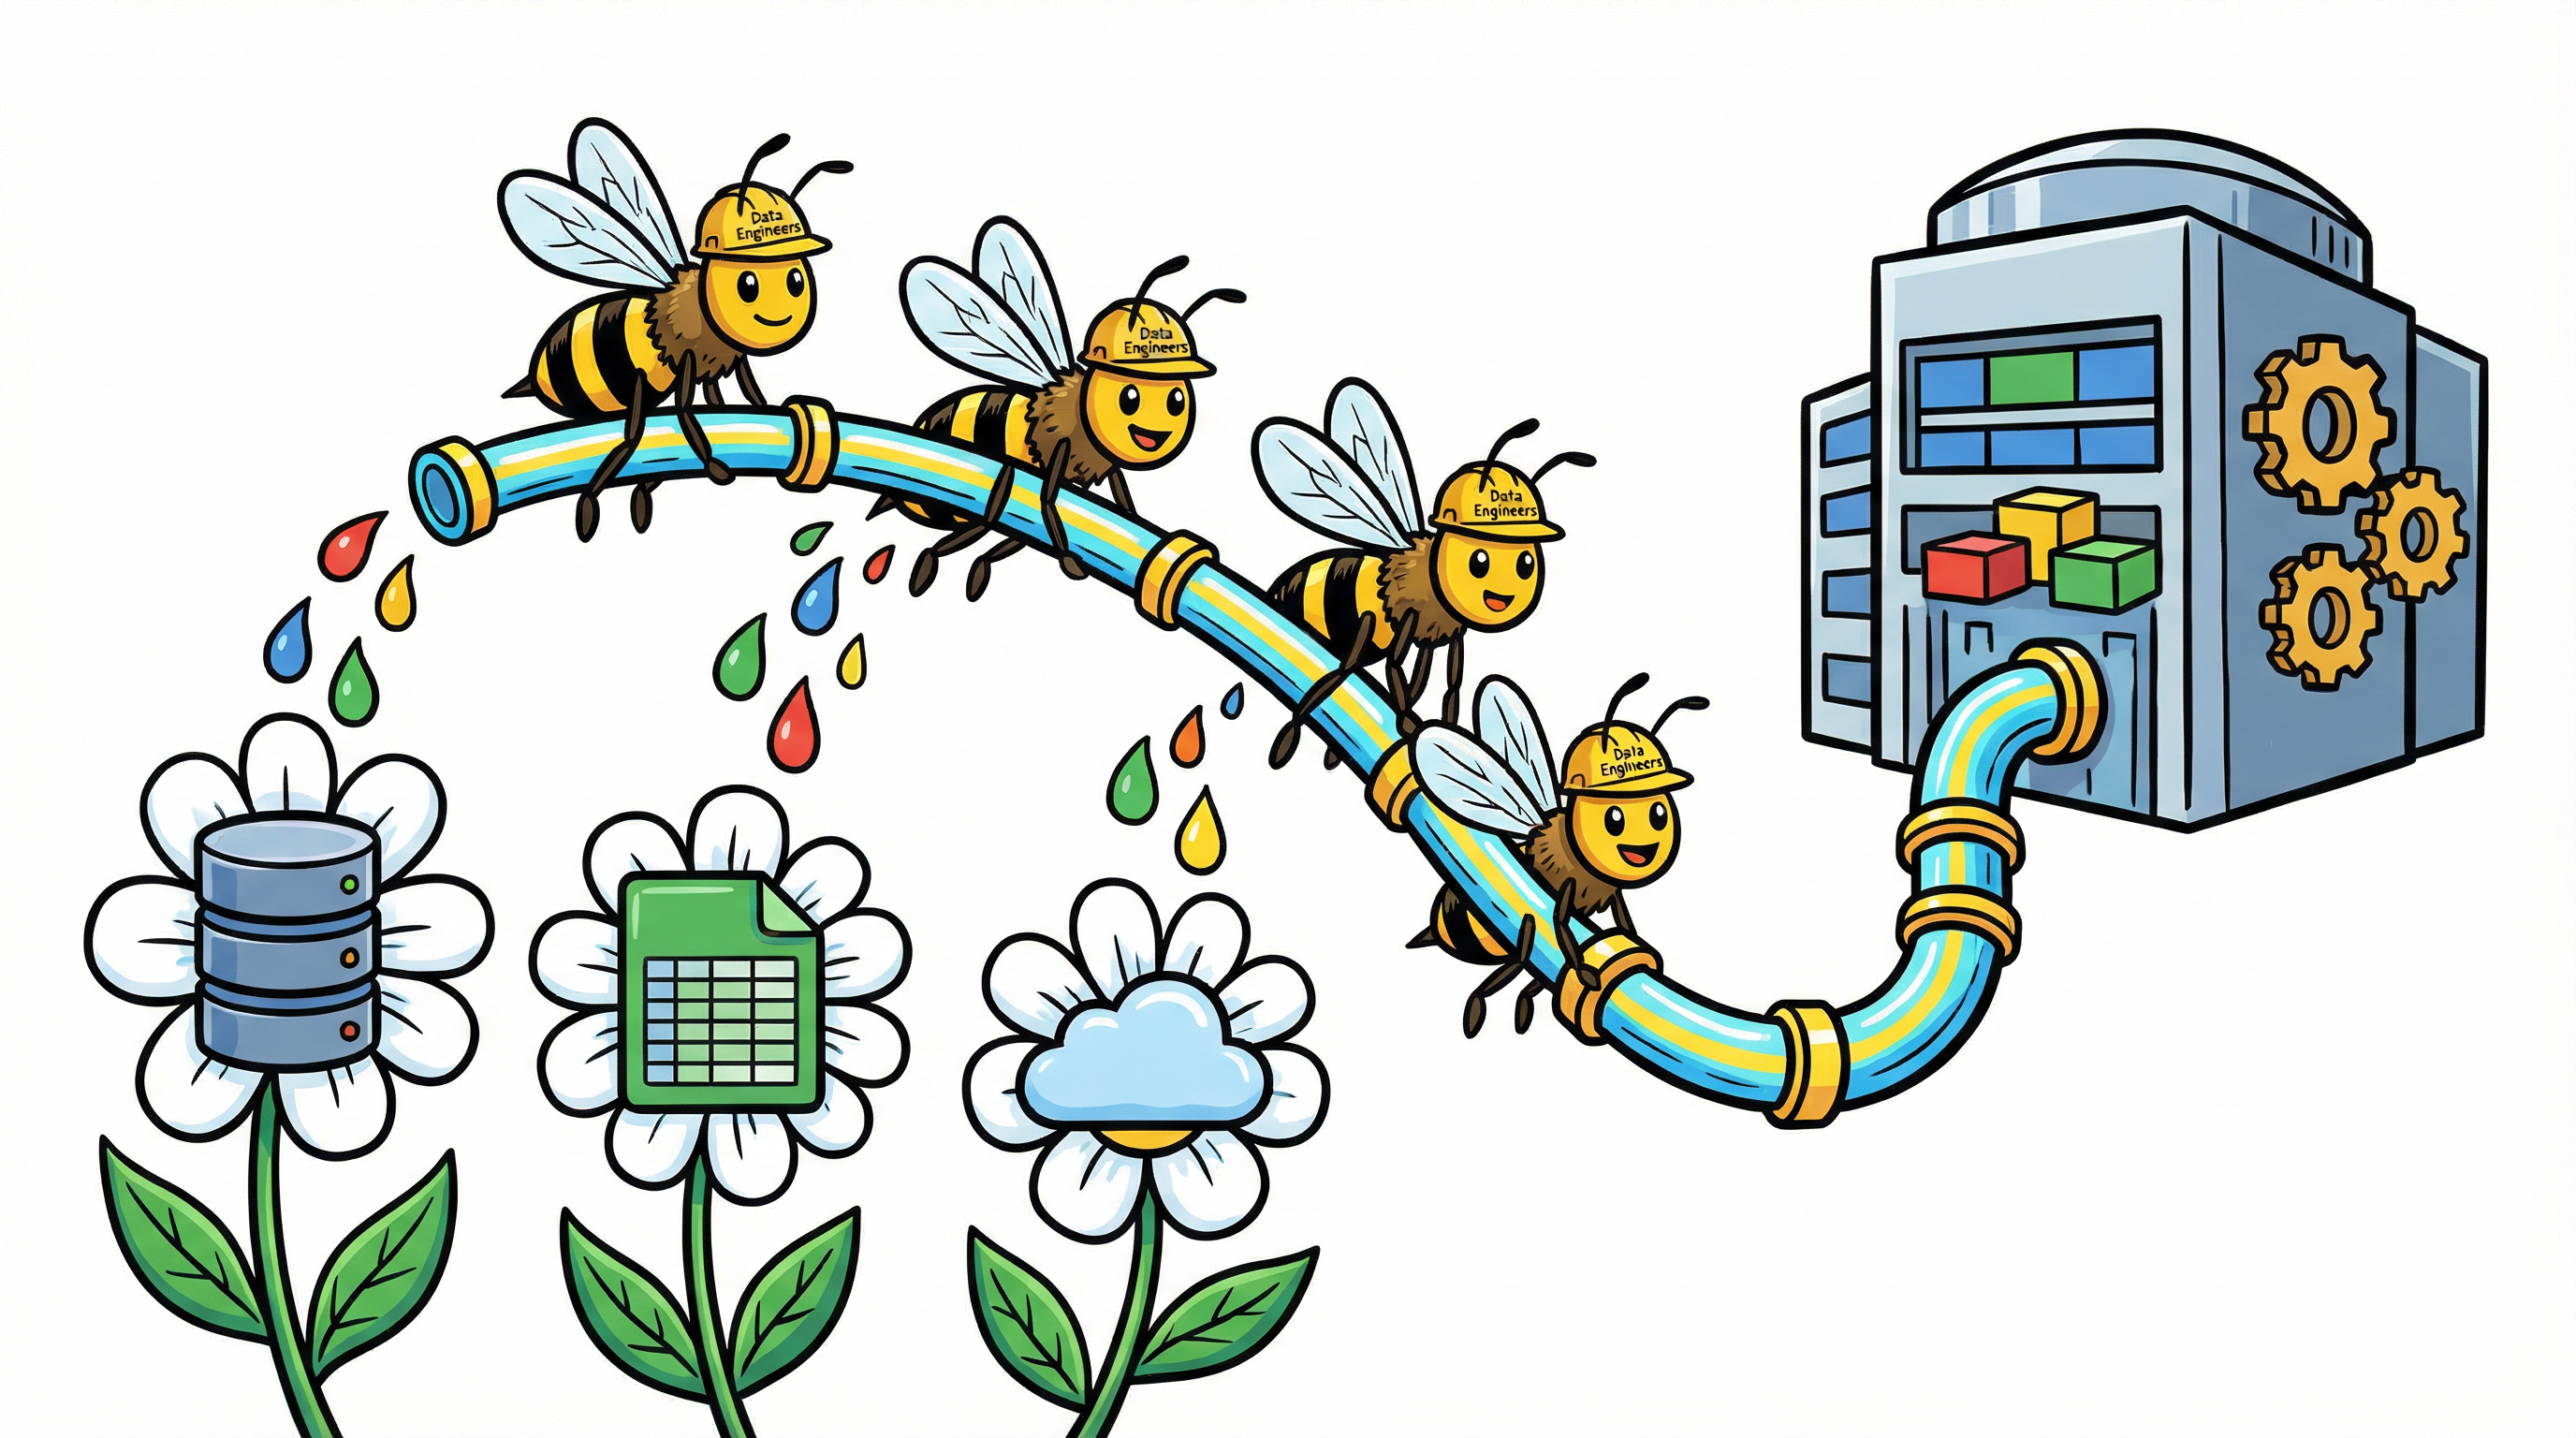
Scene 7: The Data Engineers — The Pipeline Builders
Data EngineerThe industrious bees are the Data Engineers. Following the architect's blueprint, they build automated pipelines that collect data from every source — databases, spreadsheets, cloud services — and deliver it to the data warehouse without missing a drop.
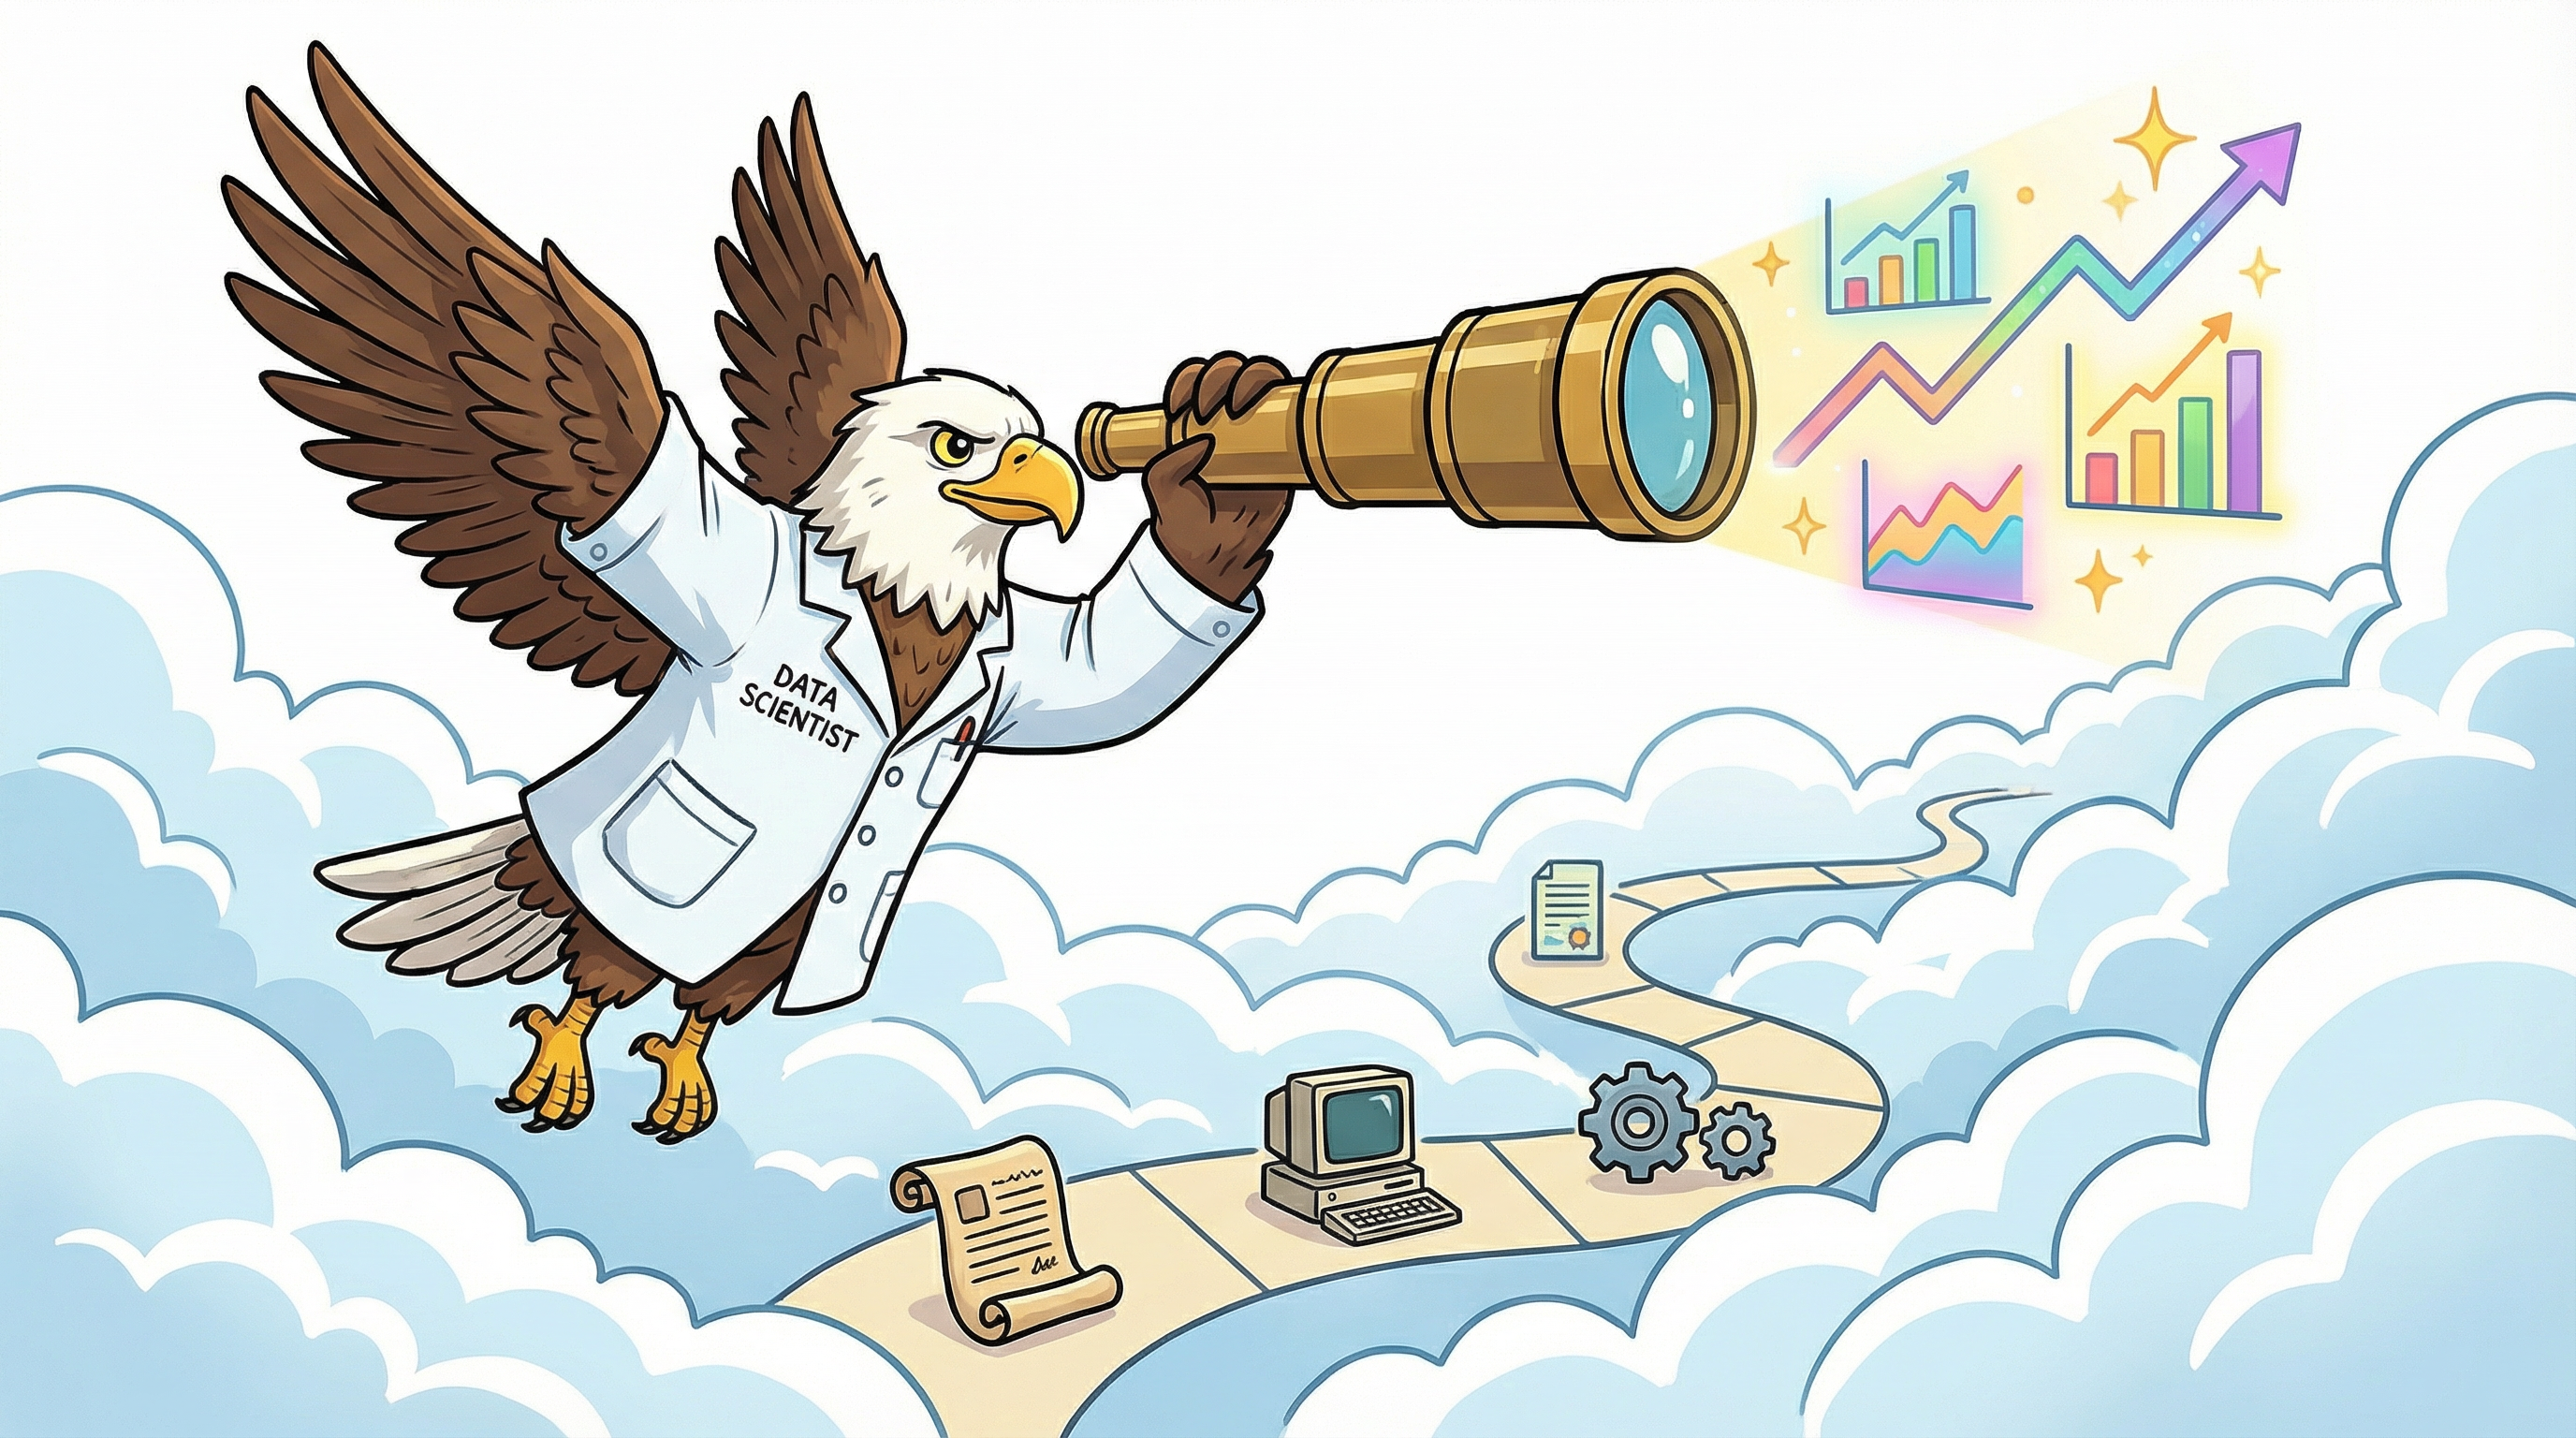
Scene 8: The Data Scientist — The Visionary
Data ScientistSoaring high above the clouds, the eagle is the Data Scientist. While analysts explain the past, the Data Scientist predicts the future. By building and training machine learning models, the eagle helps the forest prepare for what lies ahead.
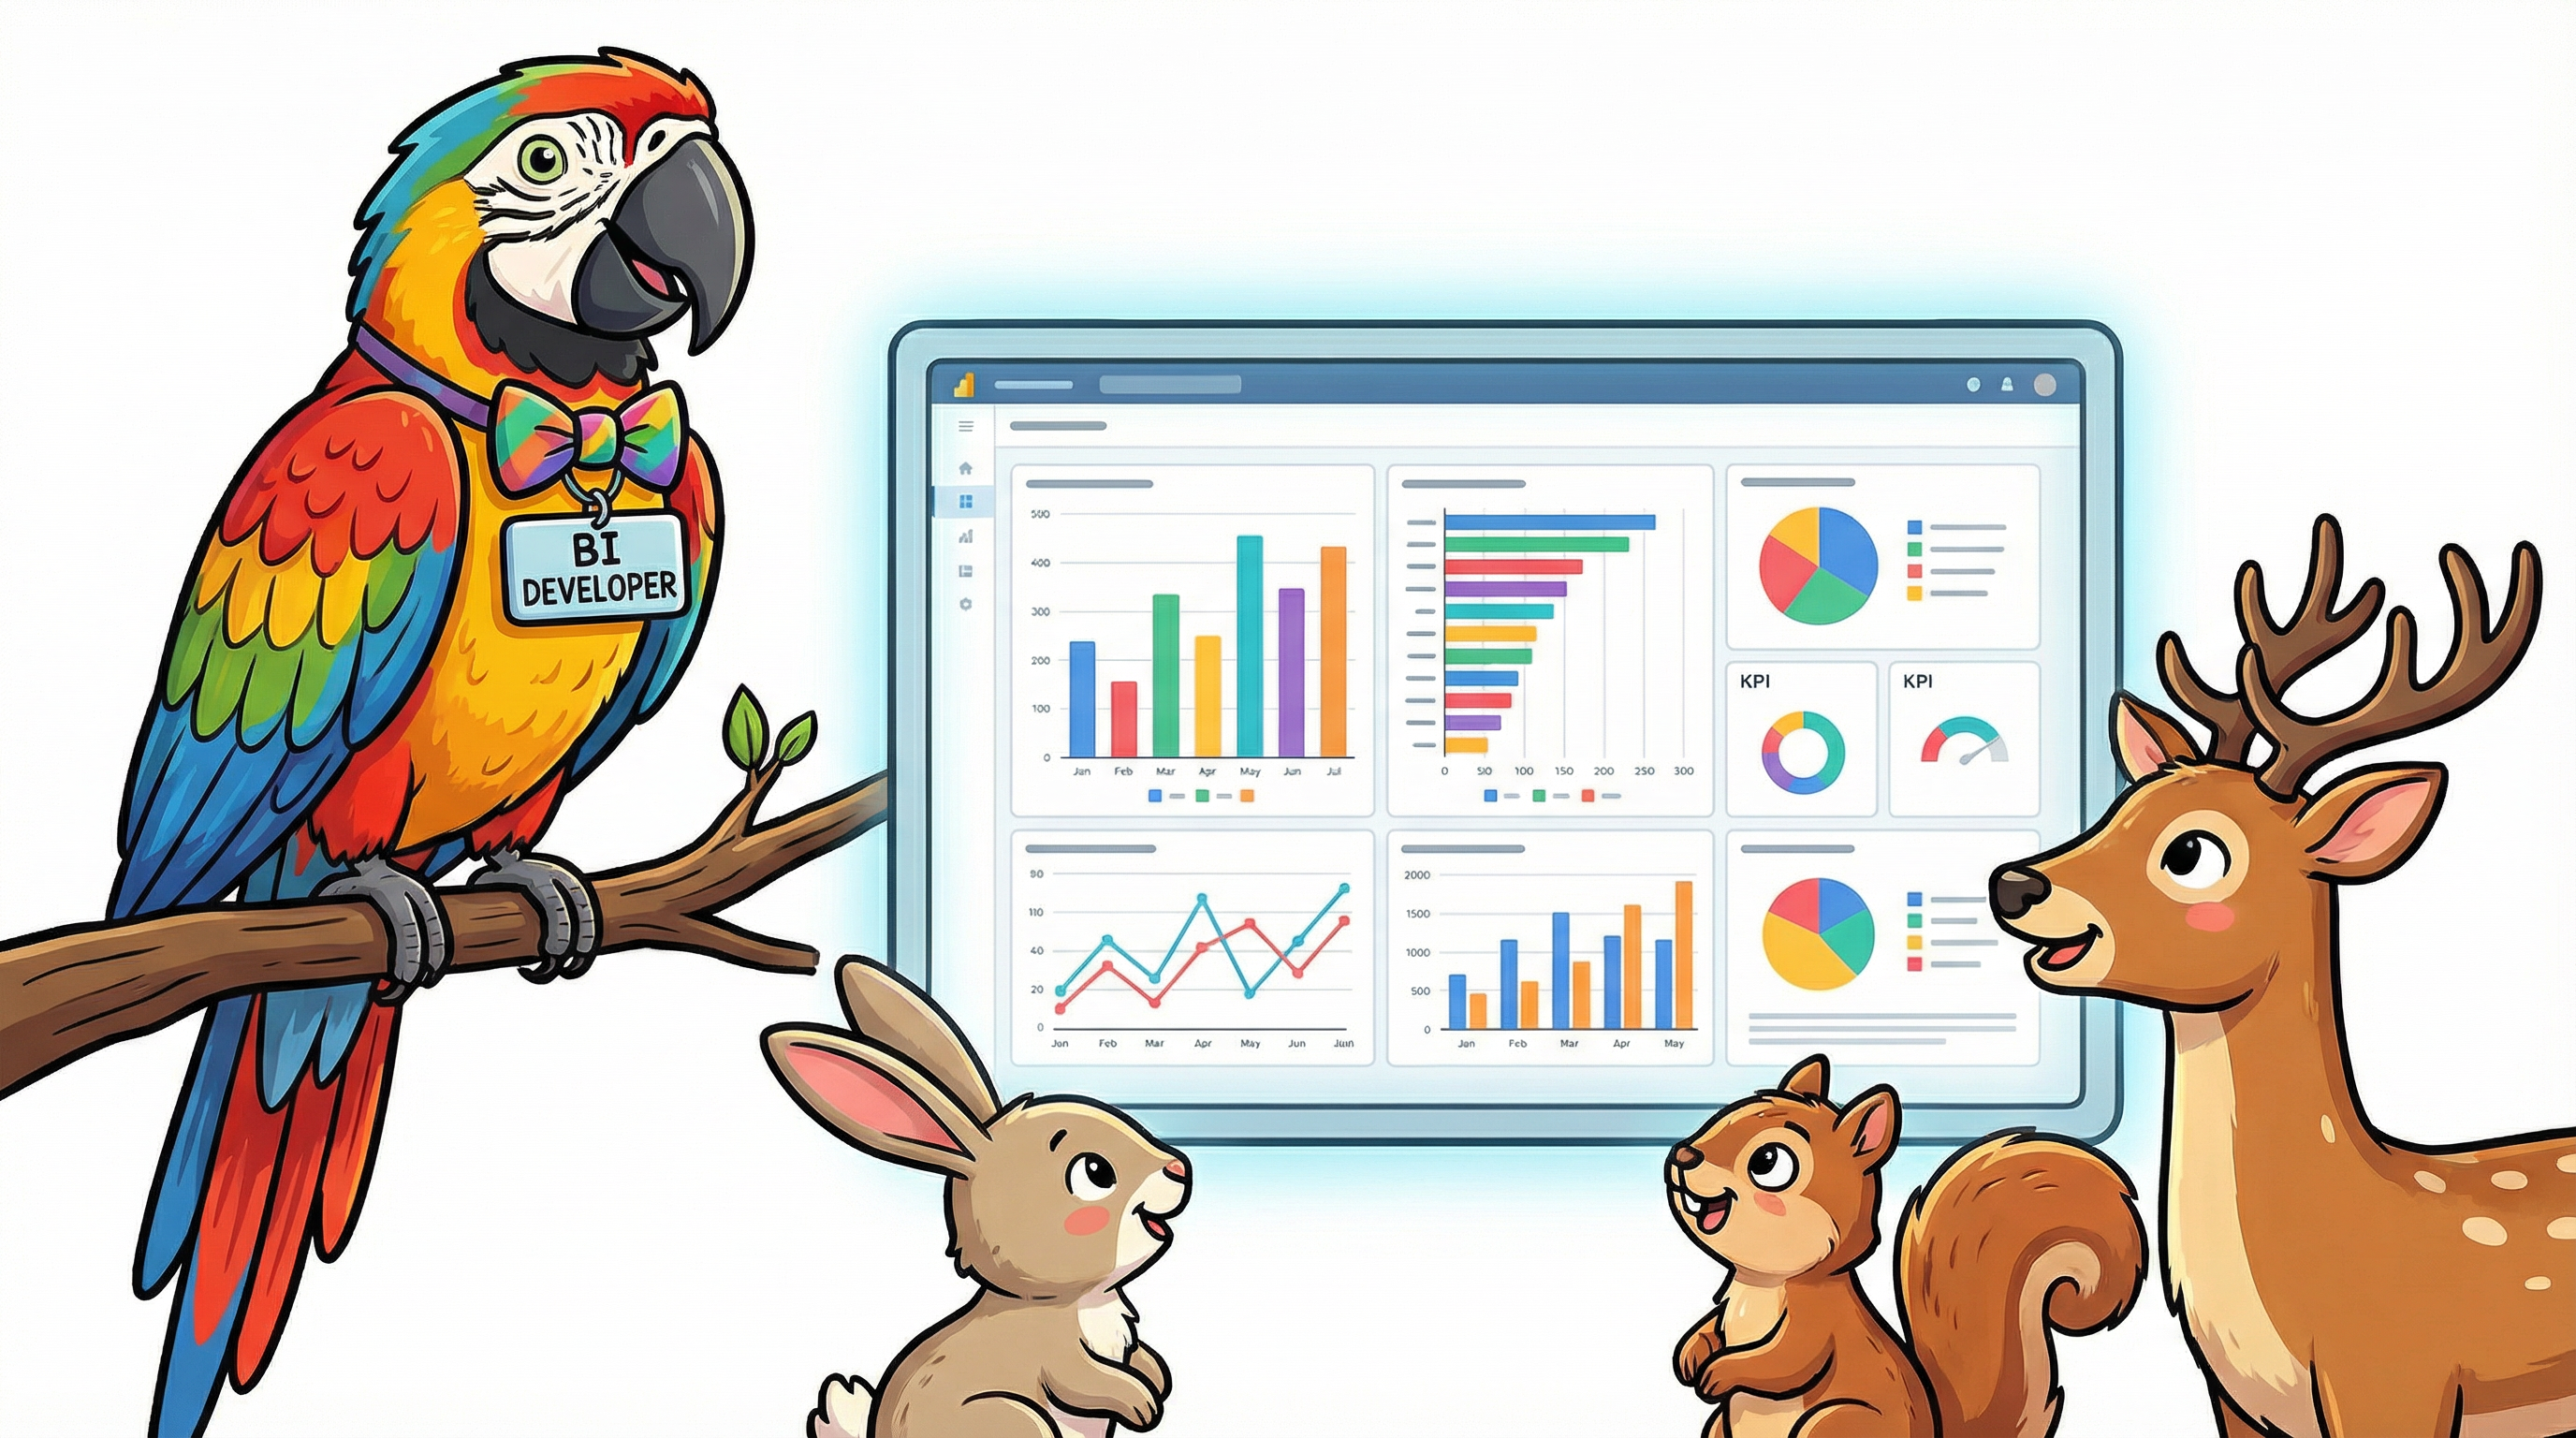
Scene 9: The BI Developer — The Storyteller
BI DeveloperThe vibrant parrot is the BI Developer (Business Intelligence Developer). The parrot transforms complex data into beautiful, interactive dashboards that everyone in the forest can understand at a glance — no technical knowledge required.
Scene 10: The ML Engineer — The Deployer
ML EngineerThe skilled spider is the Machine Learning Engineer. Once the Data Scientist builds a model, the ML Engineer deploys it into the real world — weaving it into the fabric of the entire ecosystem so it can work at scale, reliably and continuously.
Scene 11: The Data Journey — Bronze to Gold
Every piece of data follows the same transformation journey. It starts as raw, messy data in the Bronze layer. It is then cleaned and enriched in the Silver layer. Finally, it emerges as a sparkling, business-ready insight in the Gold layer — ready to power decisions.
Scene 12: The Great Tool Debate — Power BI vs. Tableau
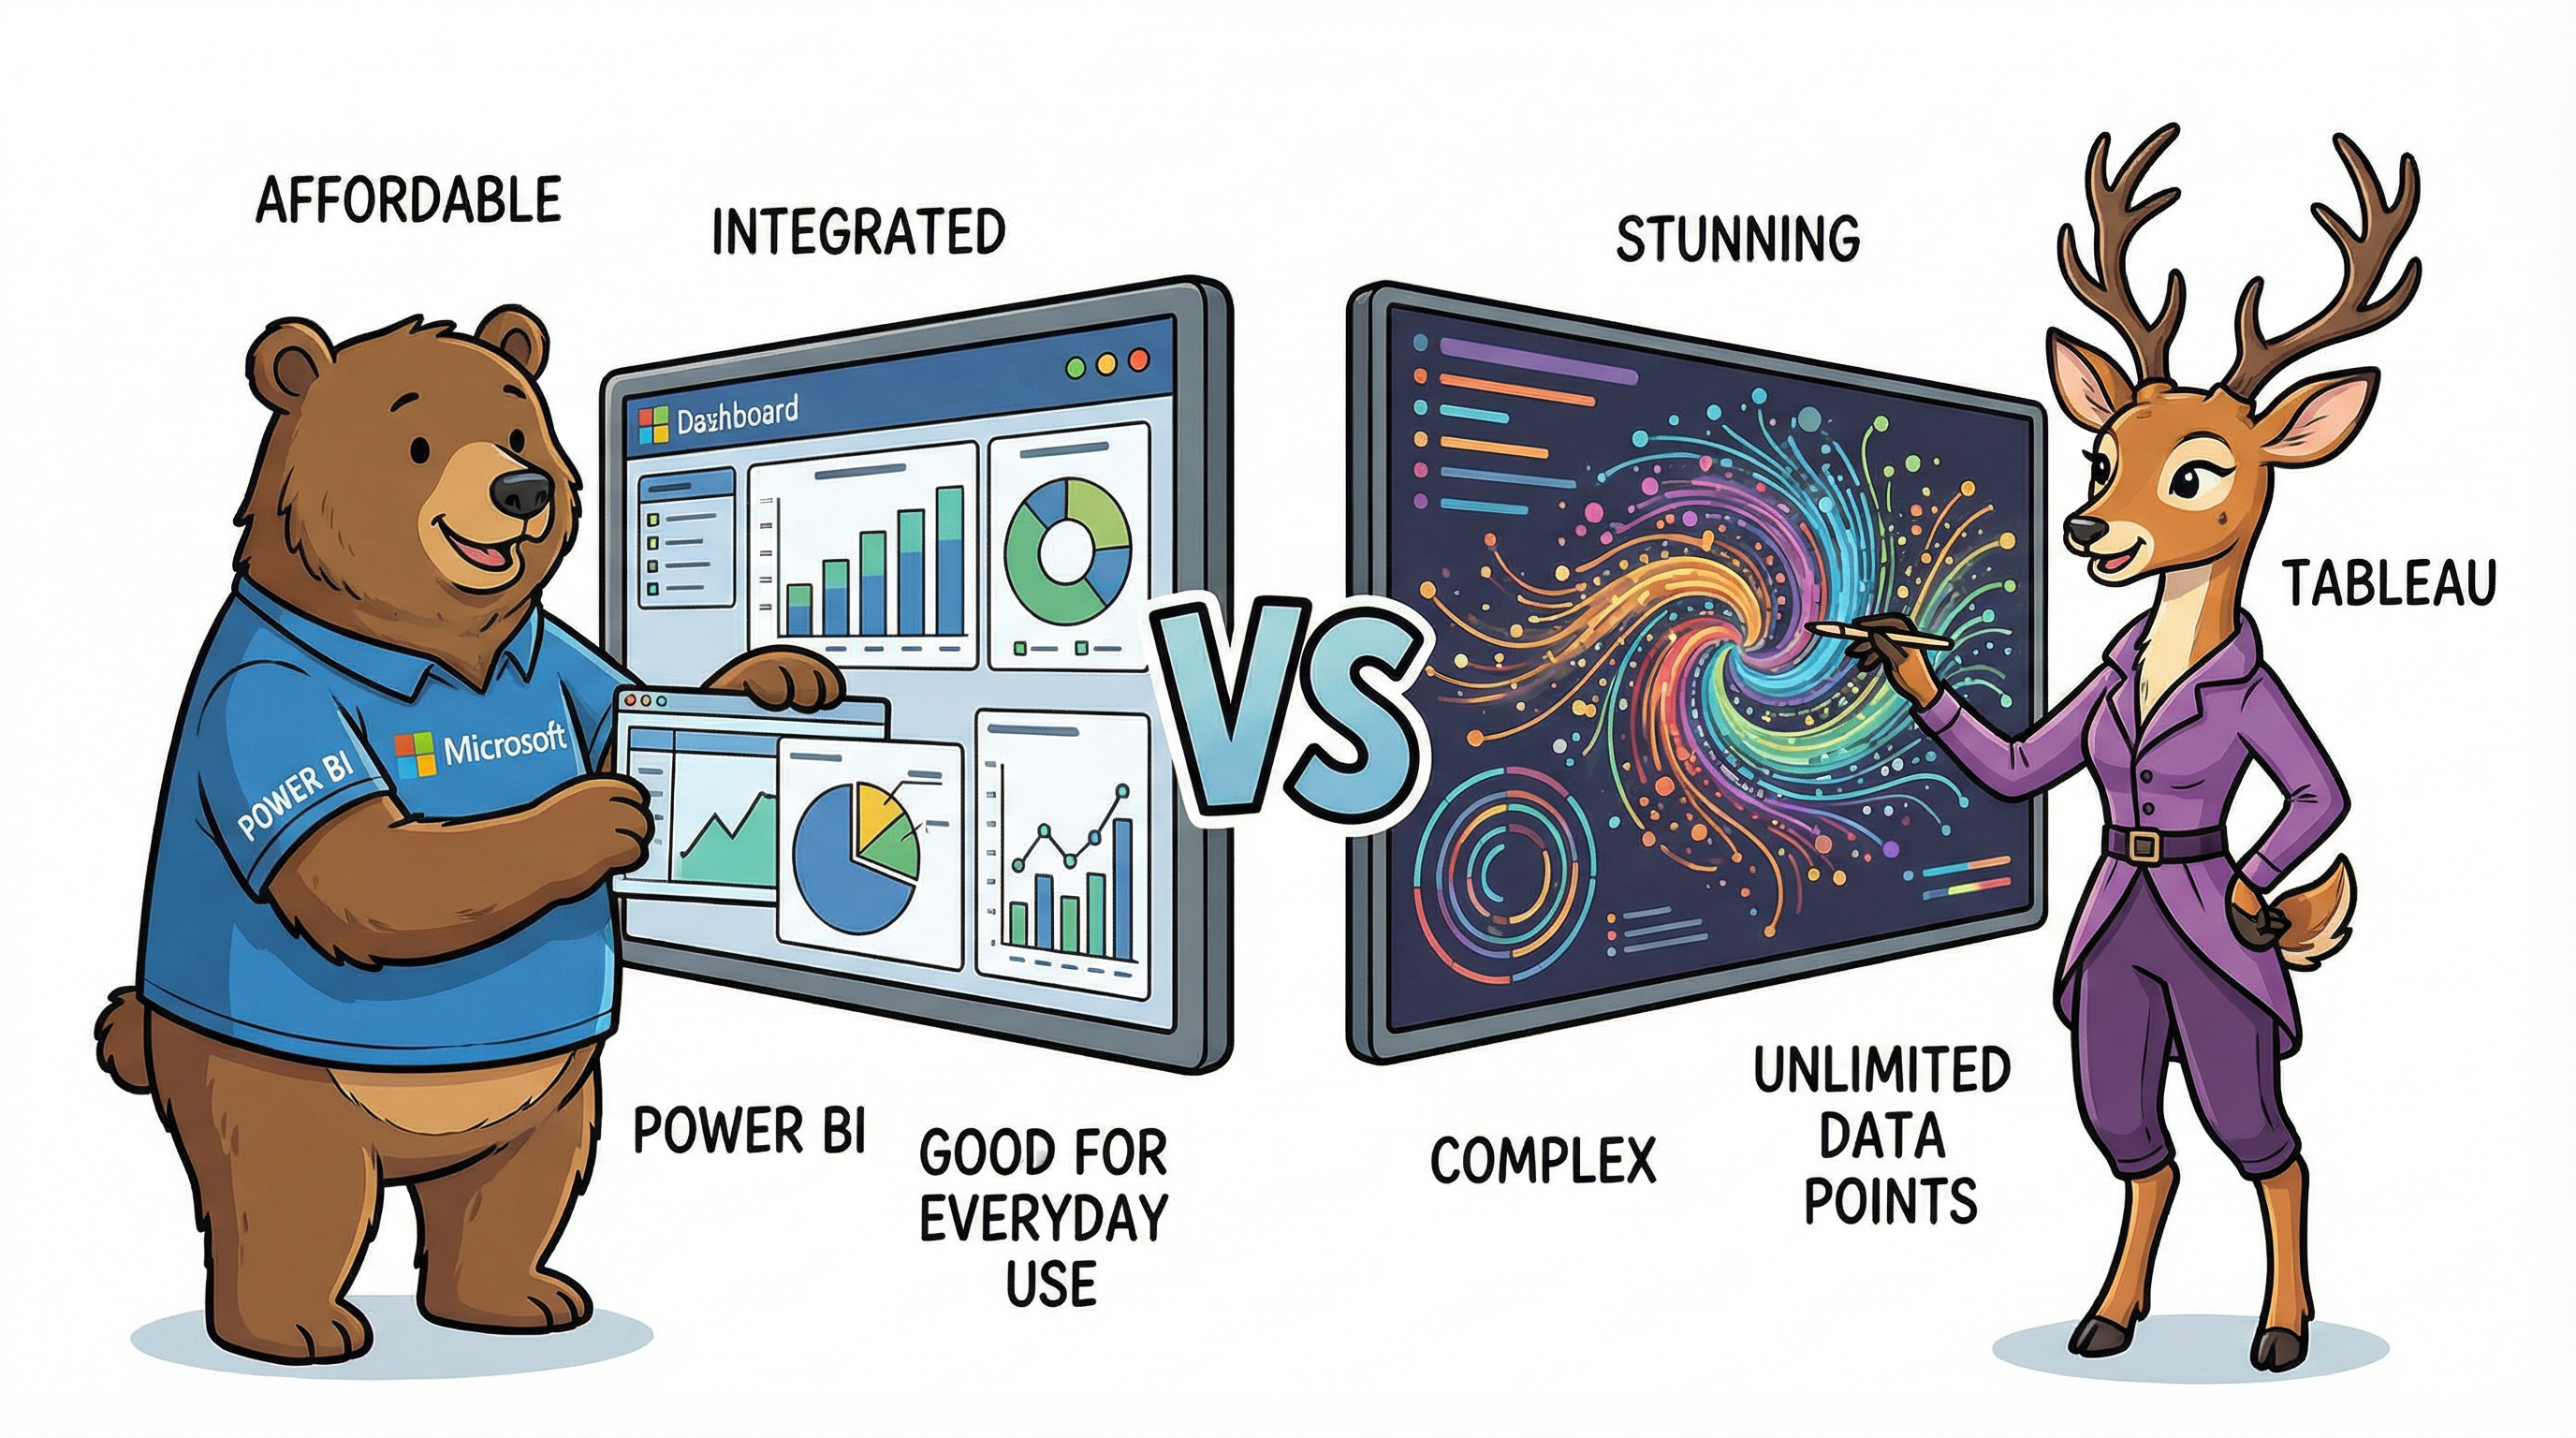
Not all visualization tools are created equal. Power BI, the reliable bear, is affordable, deeply integrated with the Microsoft ecosystem, and perfect for standard reporting. Tableau, the graceful deer, excels at advanced analytics, handles unlimited data points, and runs on both Windows and Mac.
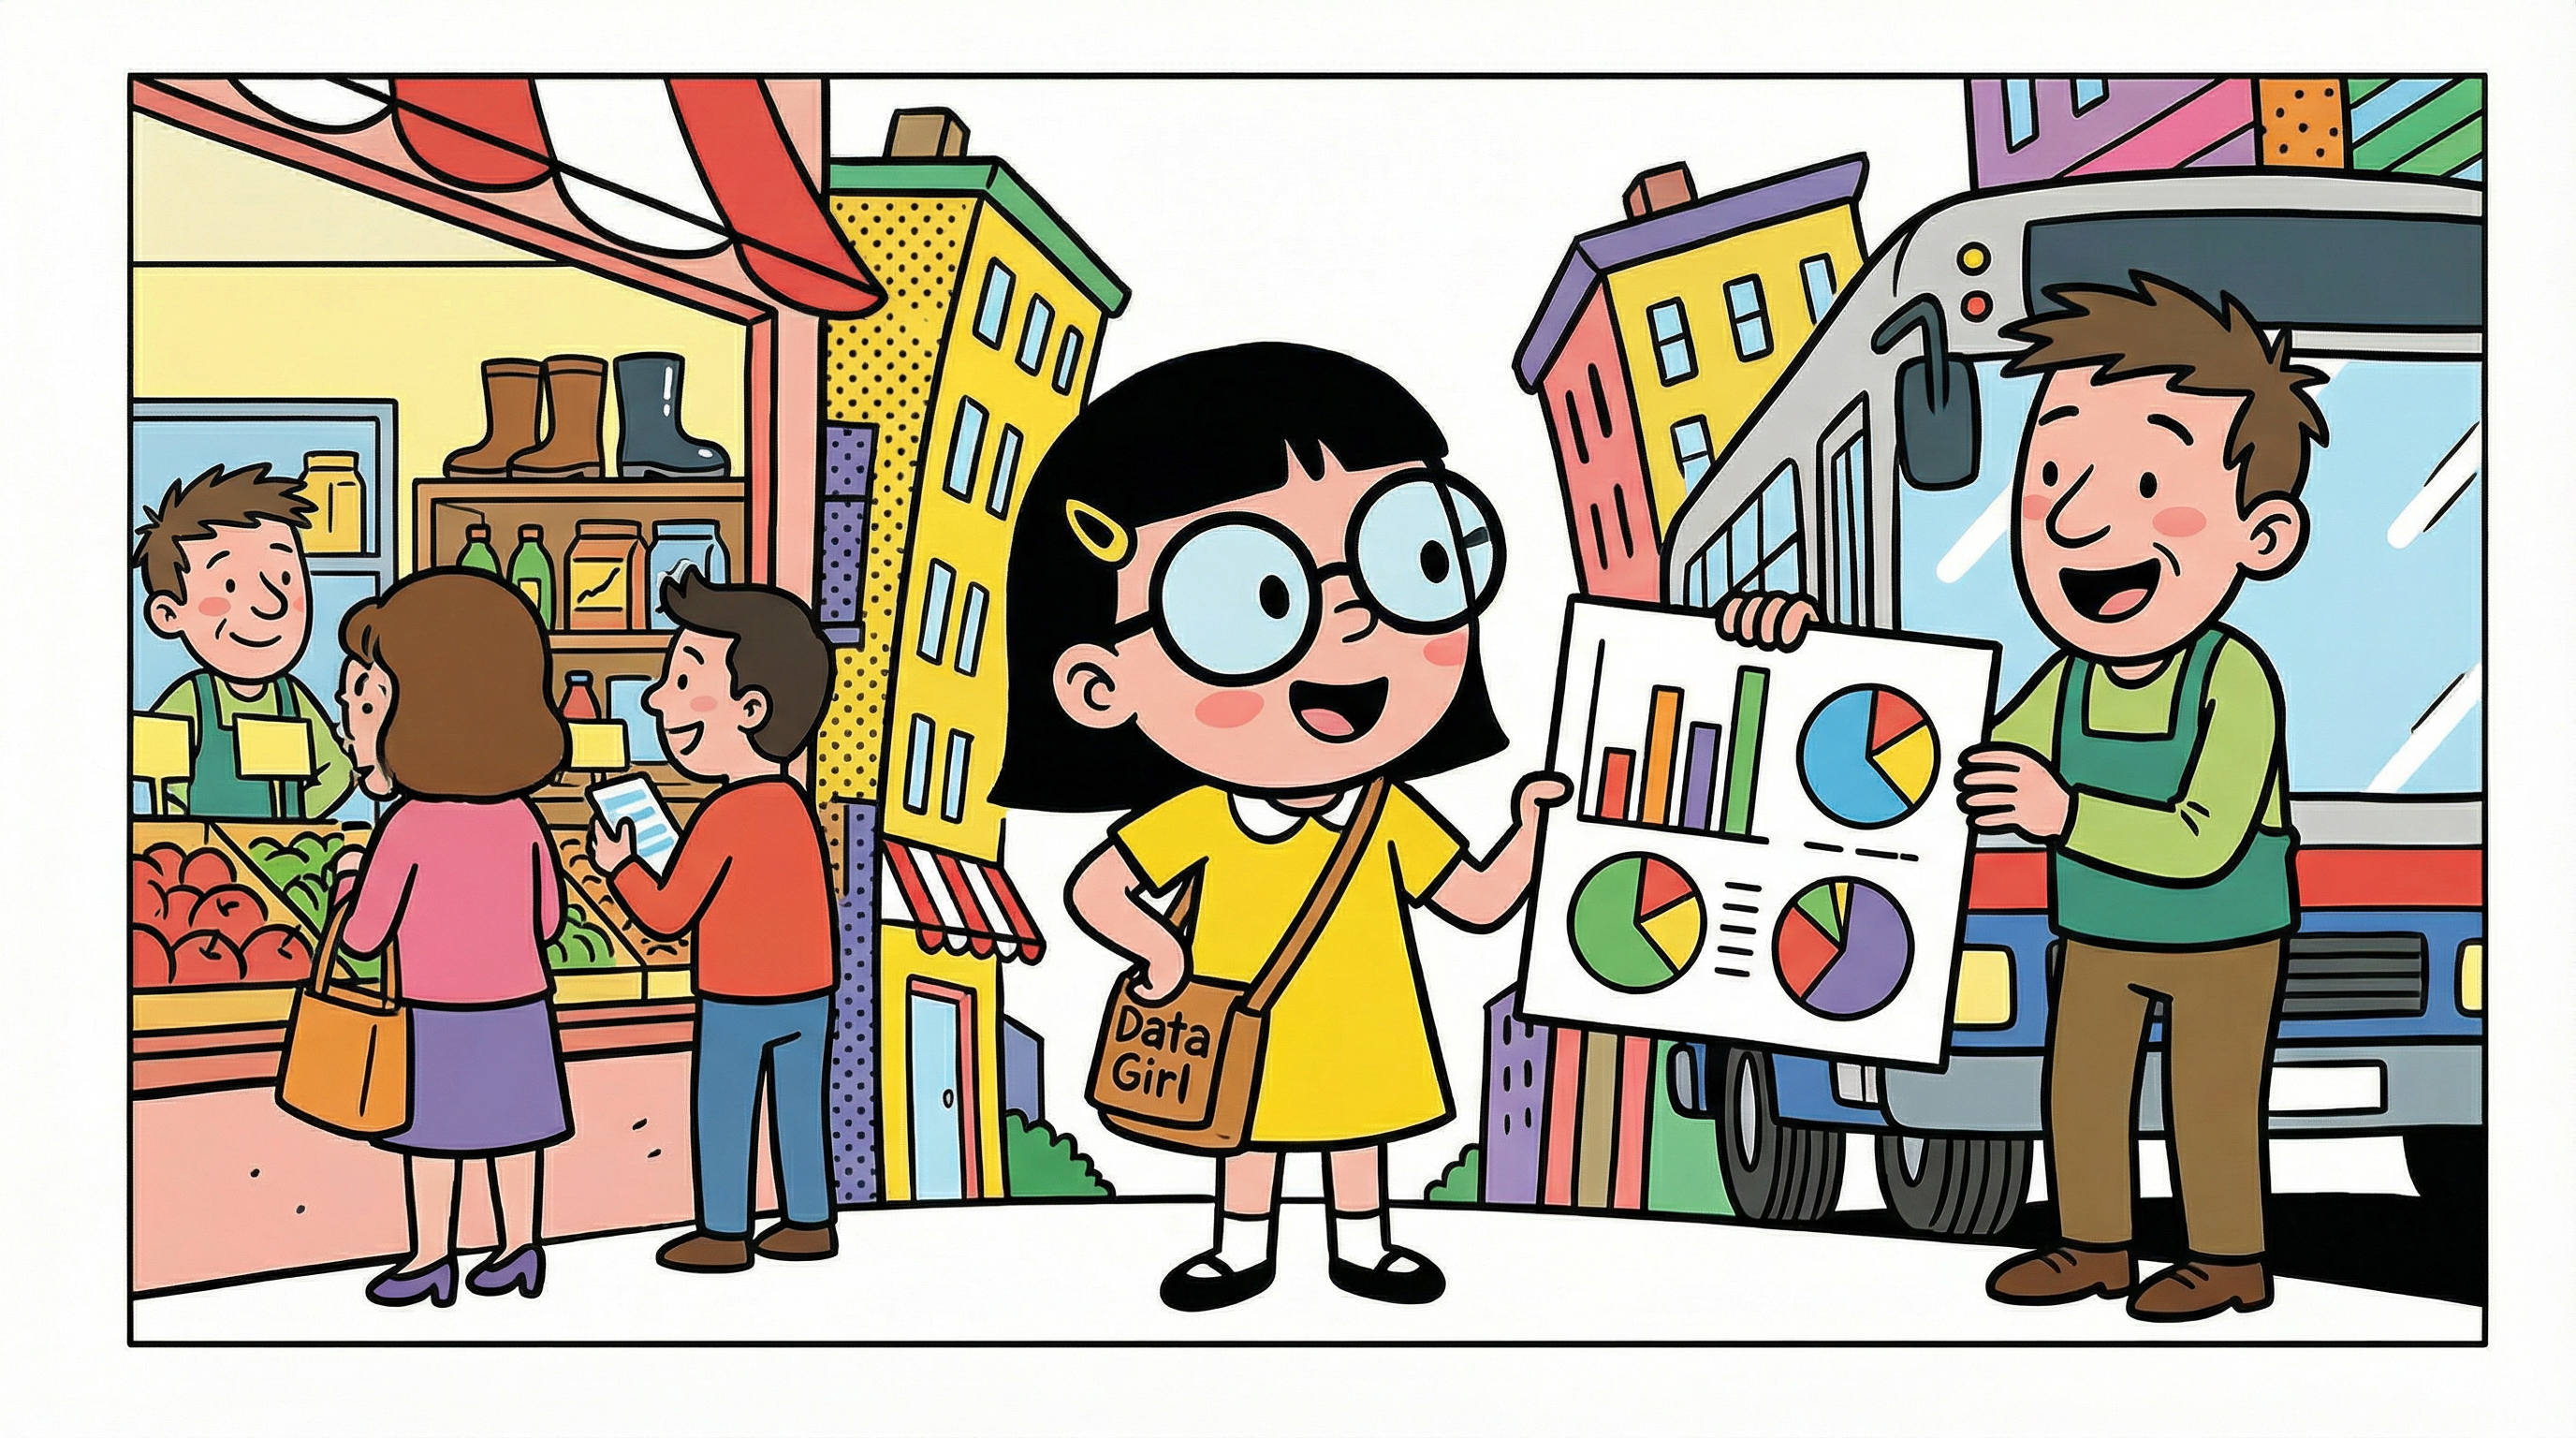
Scene 13: Data Girl Returns — Mission Accomplished
Armed with the knowledge of the Data Forest, Data Girl returns to the city. She presents clear, data-driven insights to the shop owner. The shop is now organized, stocked with the right products, and full of happy customers. The chaos is gone — replaced by clarity.
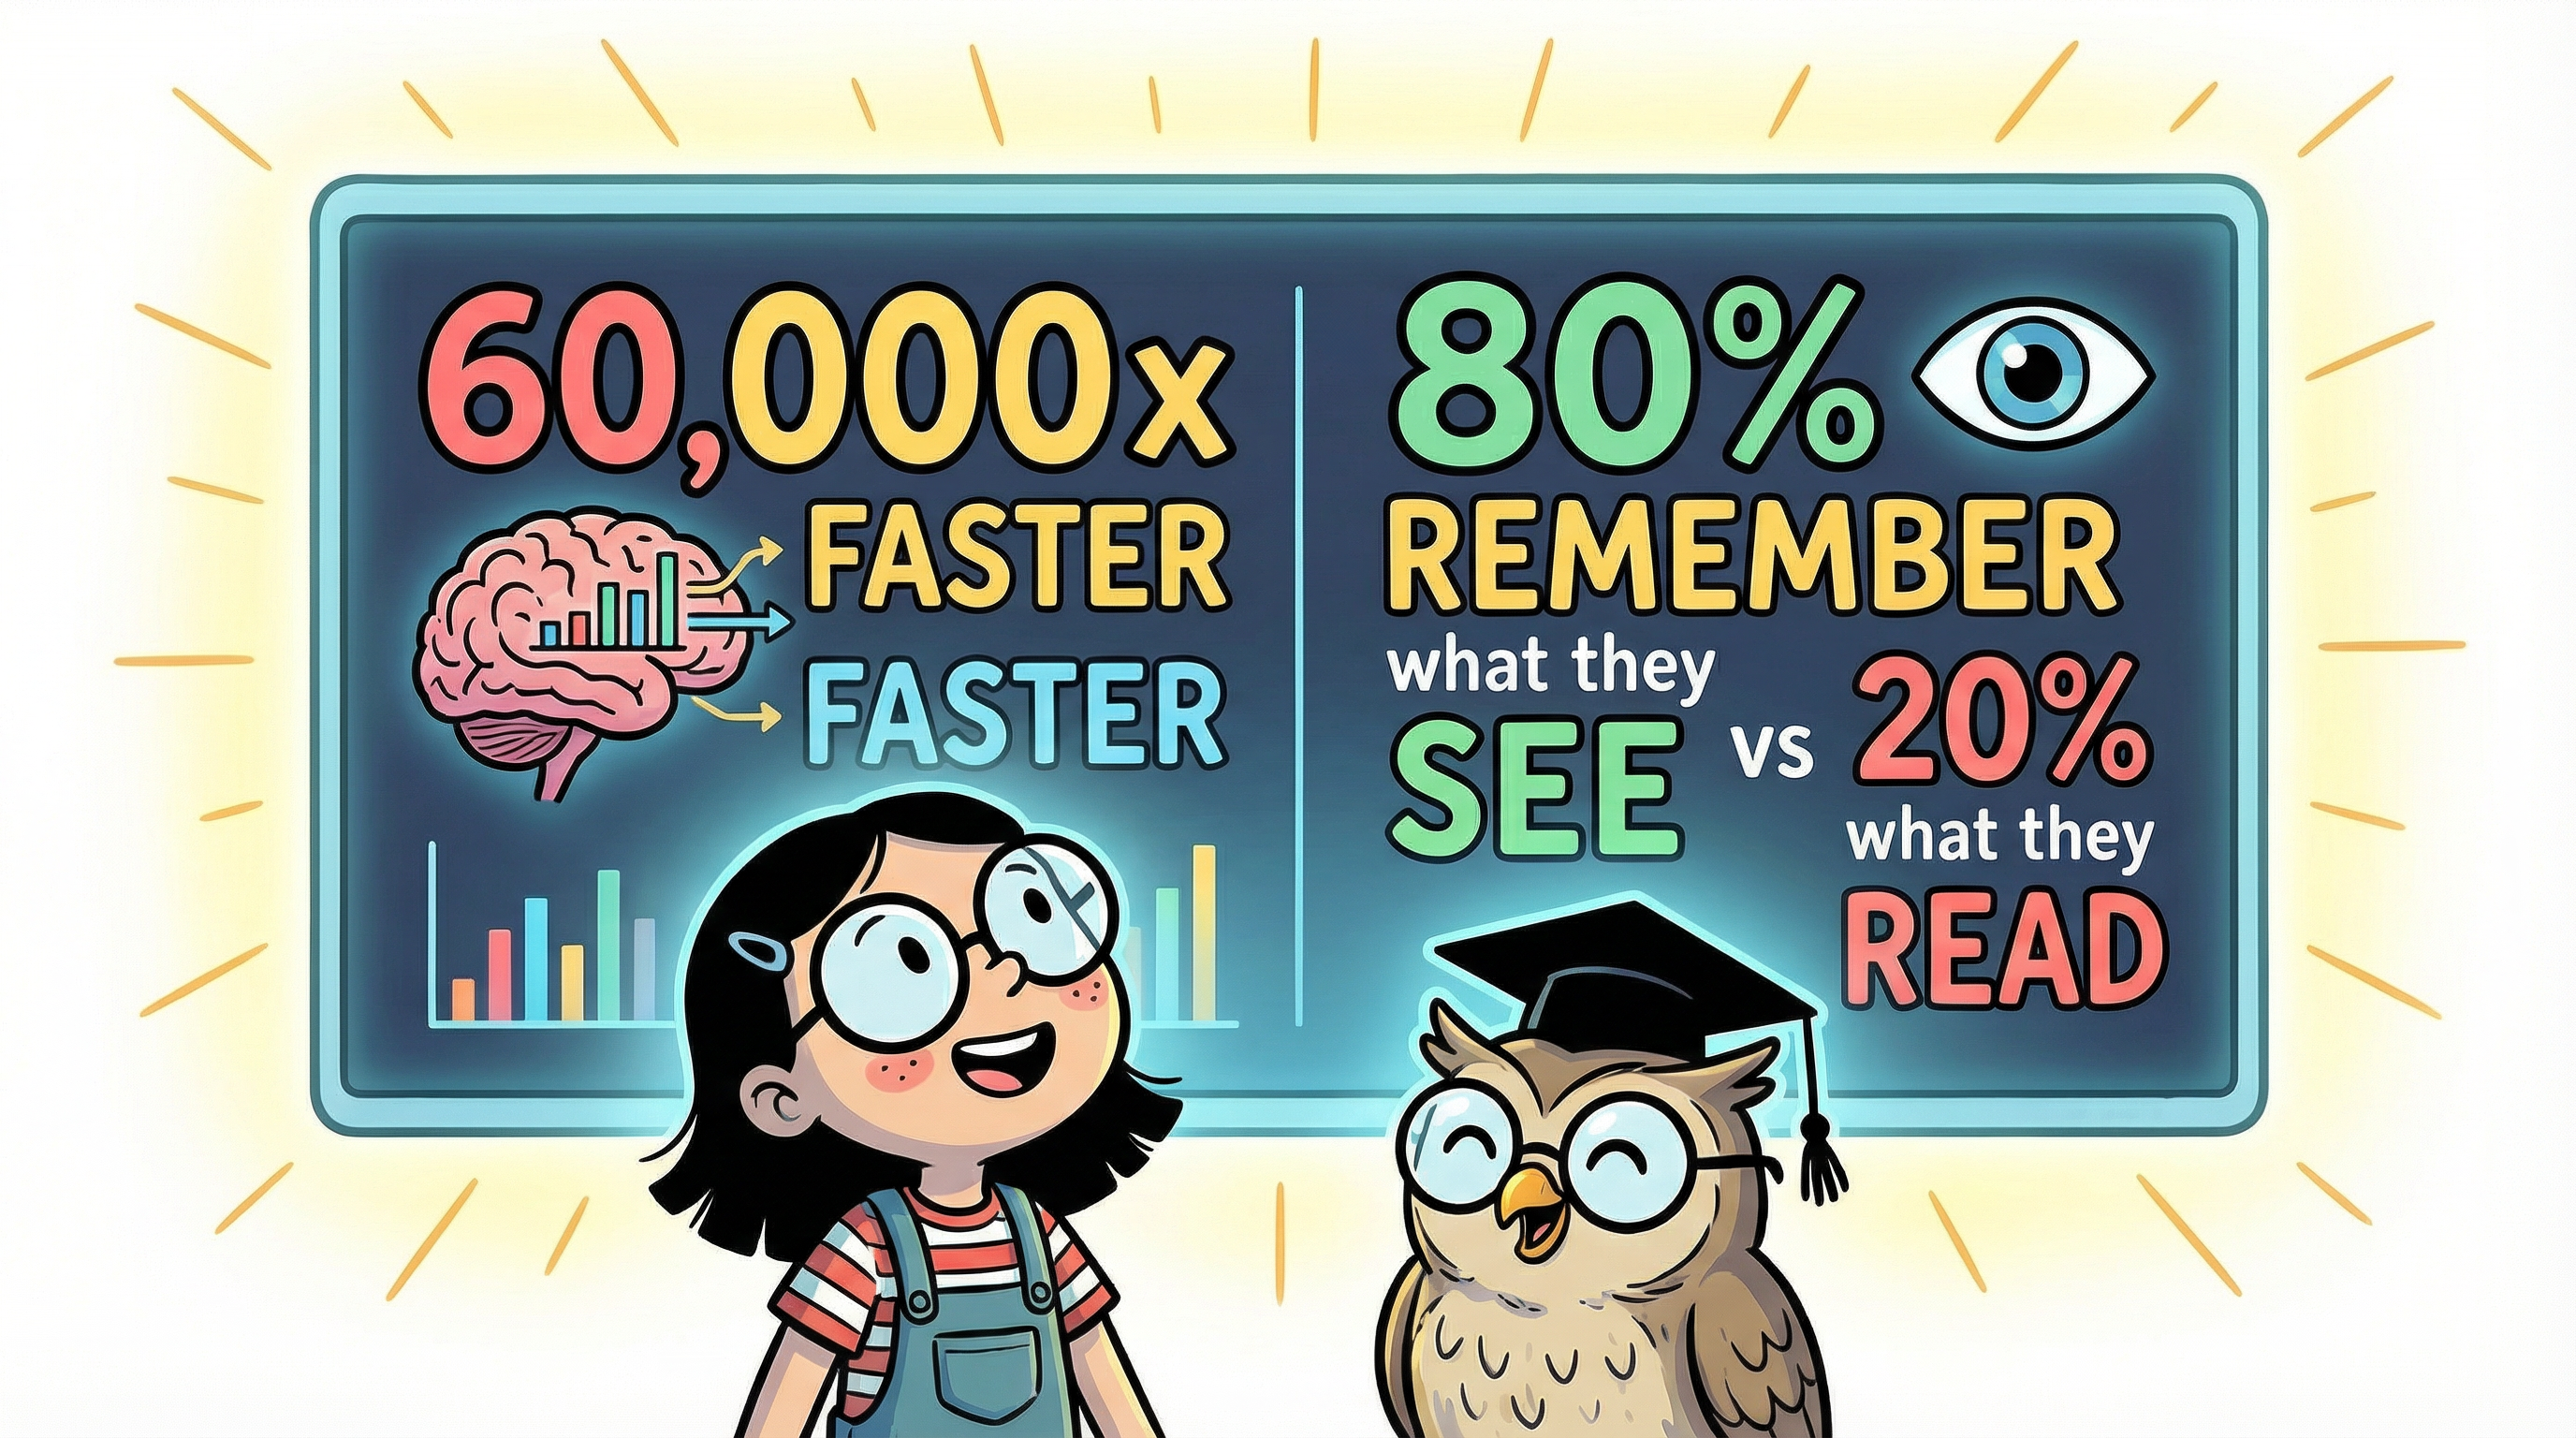
Scene 14: The Power of Visual Data
The final lesson from the wise owl: data is most powerful when it is visualized. The human brain processes images 60,000 times faster than text. And people remember 80% of what they see, compared to just 20% of what they read. This is why data storytelling matters.